>>> """
===============================
Resizing axes with tight layout
===============================
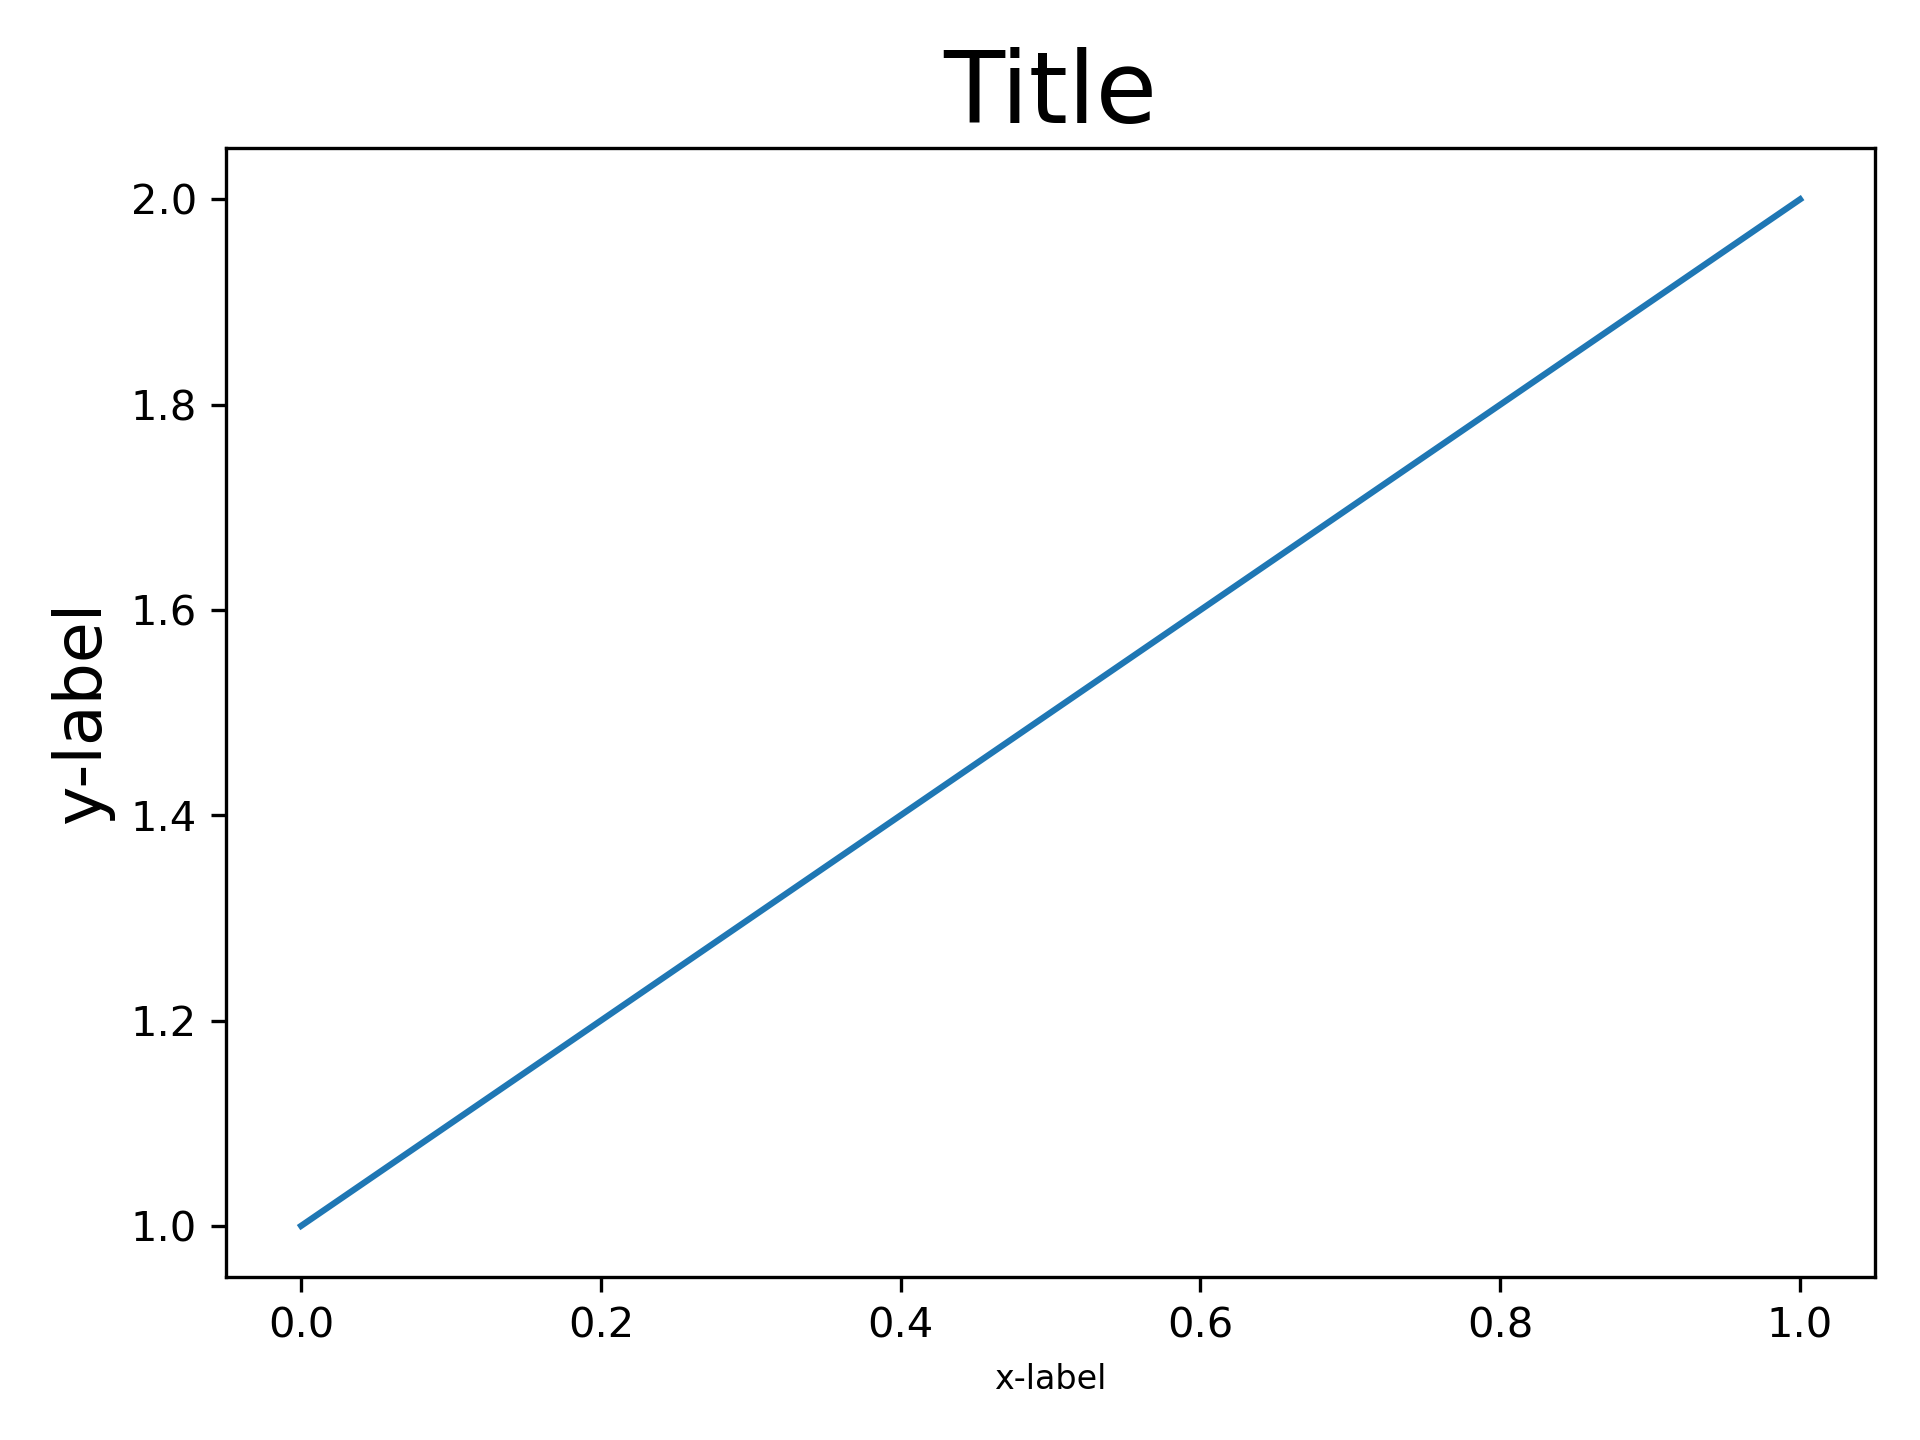
`~.figure.Figure.tight_layout` attempts to resize subplots in
a figure so that there are no overlaps between axes objects and labels
on the axes.
See :doc:`/tutorials/intermediate/tight_layout_guide` for more details and
:doc:`/tutorials/intermediate/constrainedlayout_guide` for an alternative.
"""
...
... import matplotlib.pyplot as plt
... import itertools
... import warnings
...
...
... fontsizes = itertools.cycle([8, 16, 24, 32])
...
...
... def example_plot(ax):
... ax.plot([1, 2])
... ax.set_xlabel('x-label', fontsize=next(fontsizes))
... ax.set_ylabel('y-label', fontsize=next(fontsizes))
... ax.set_title('Title', fontsize=next(fontsizes))
...
...
... ###############################################################################
...
... fig, ax = plt.subplots()
... example_plot(ax)
... fig.tight_layout()
...
... ###############################################################################
...
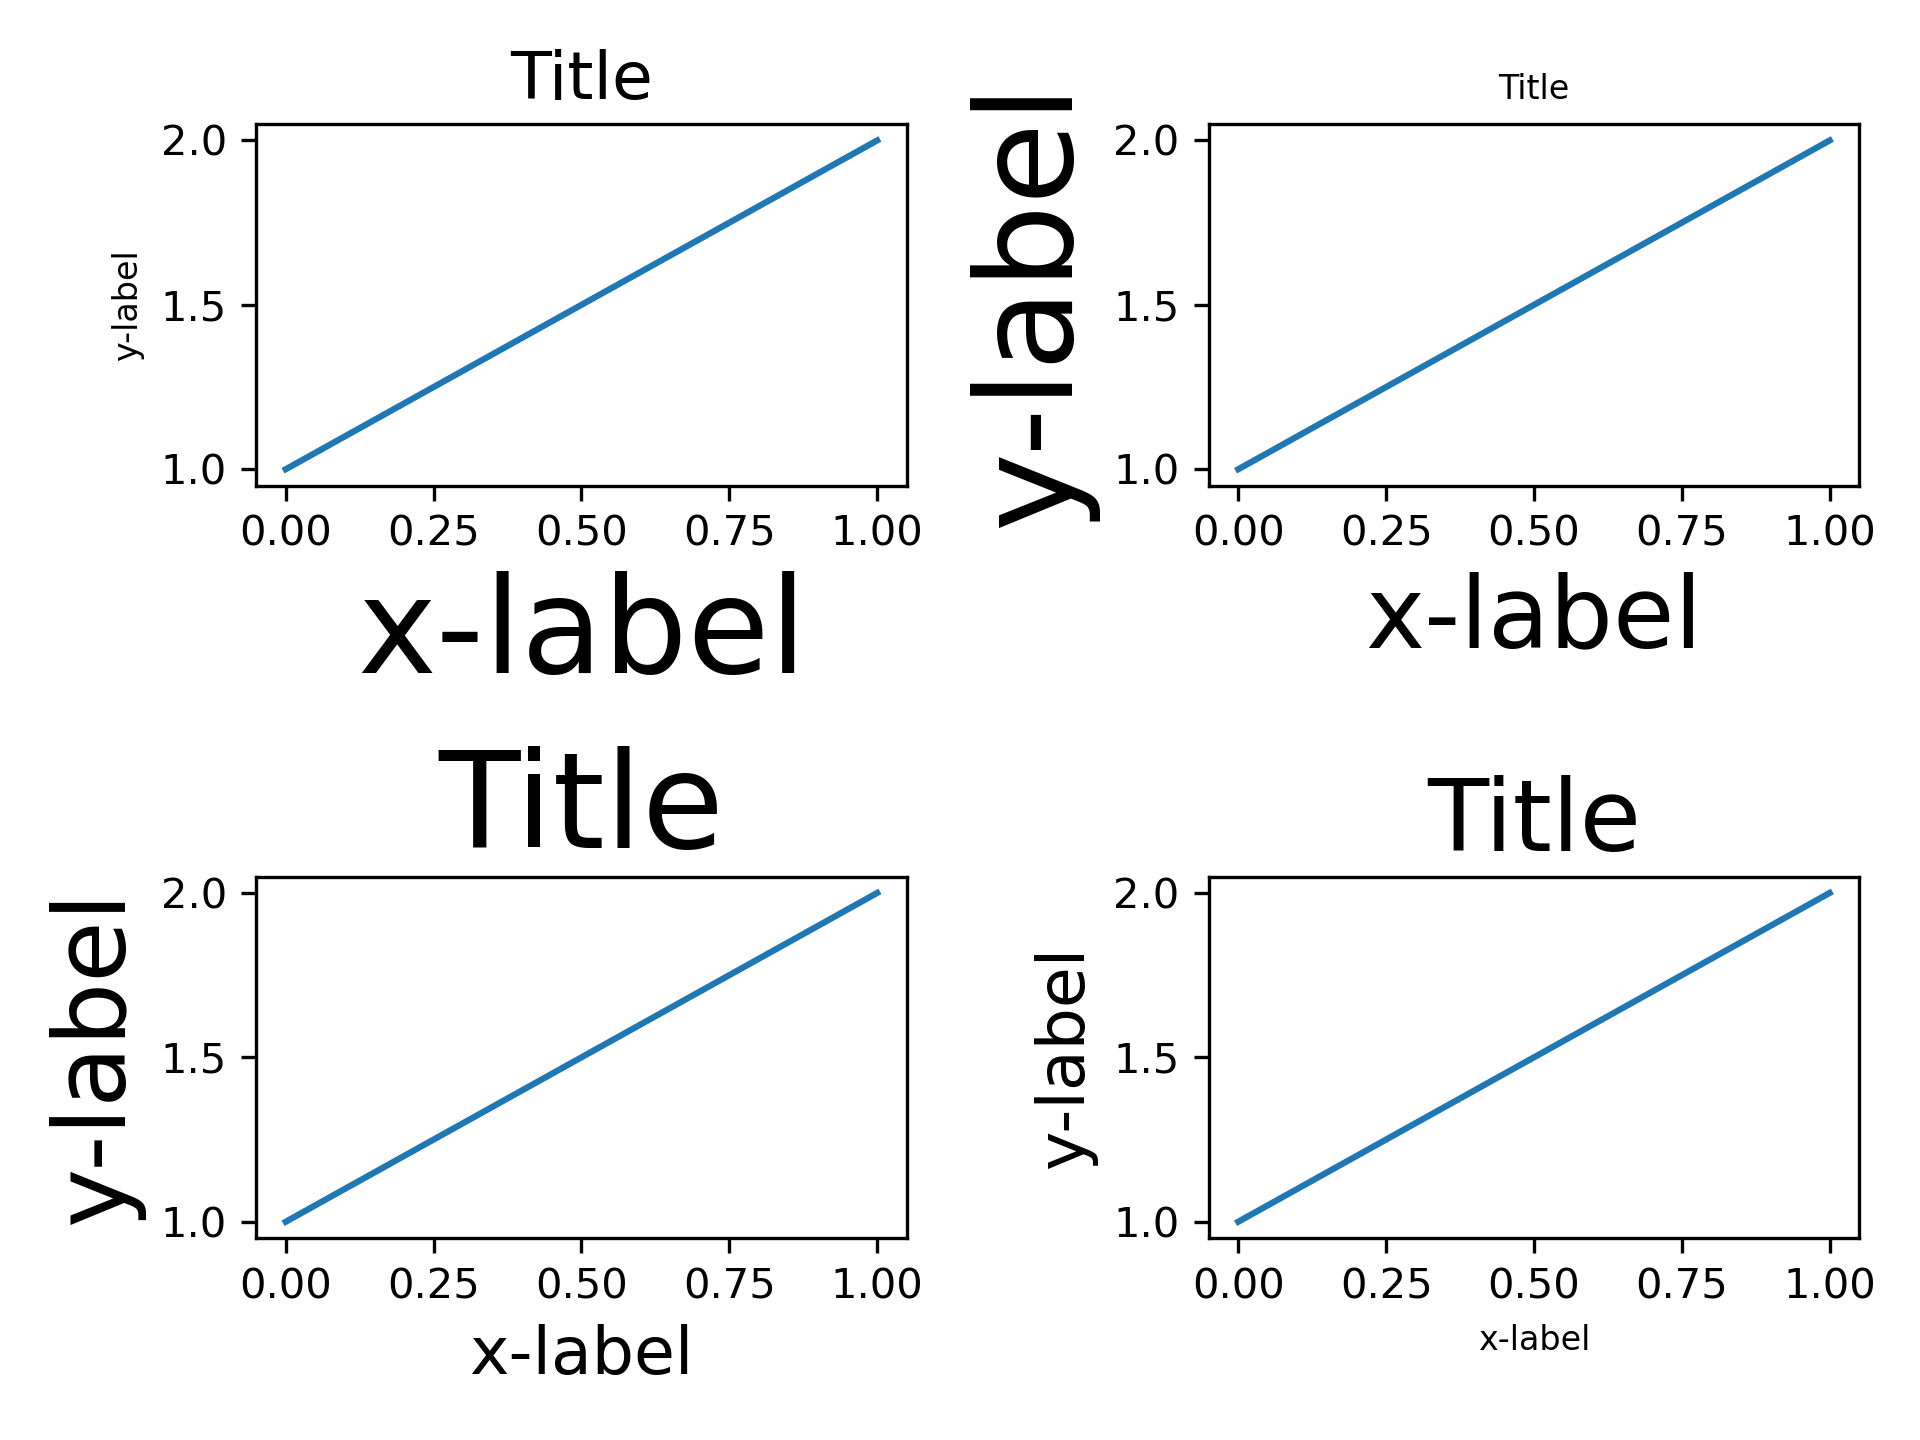
... fig, ((ax1, ax2), (ax3, ax4)) = plt.subplots(nrows=2, ncols=2)
... example_plot(ax1)
... example_plot(ax2)
... example_plot(ax3)
... example_plot(ax4)
... fig.tight_layout()
...
... ###############################################################################
...
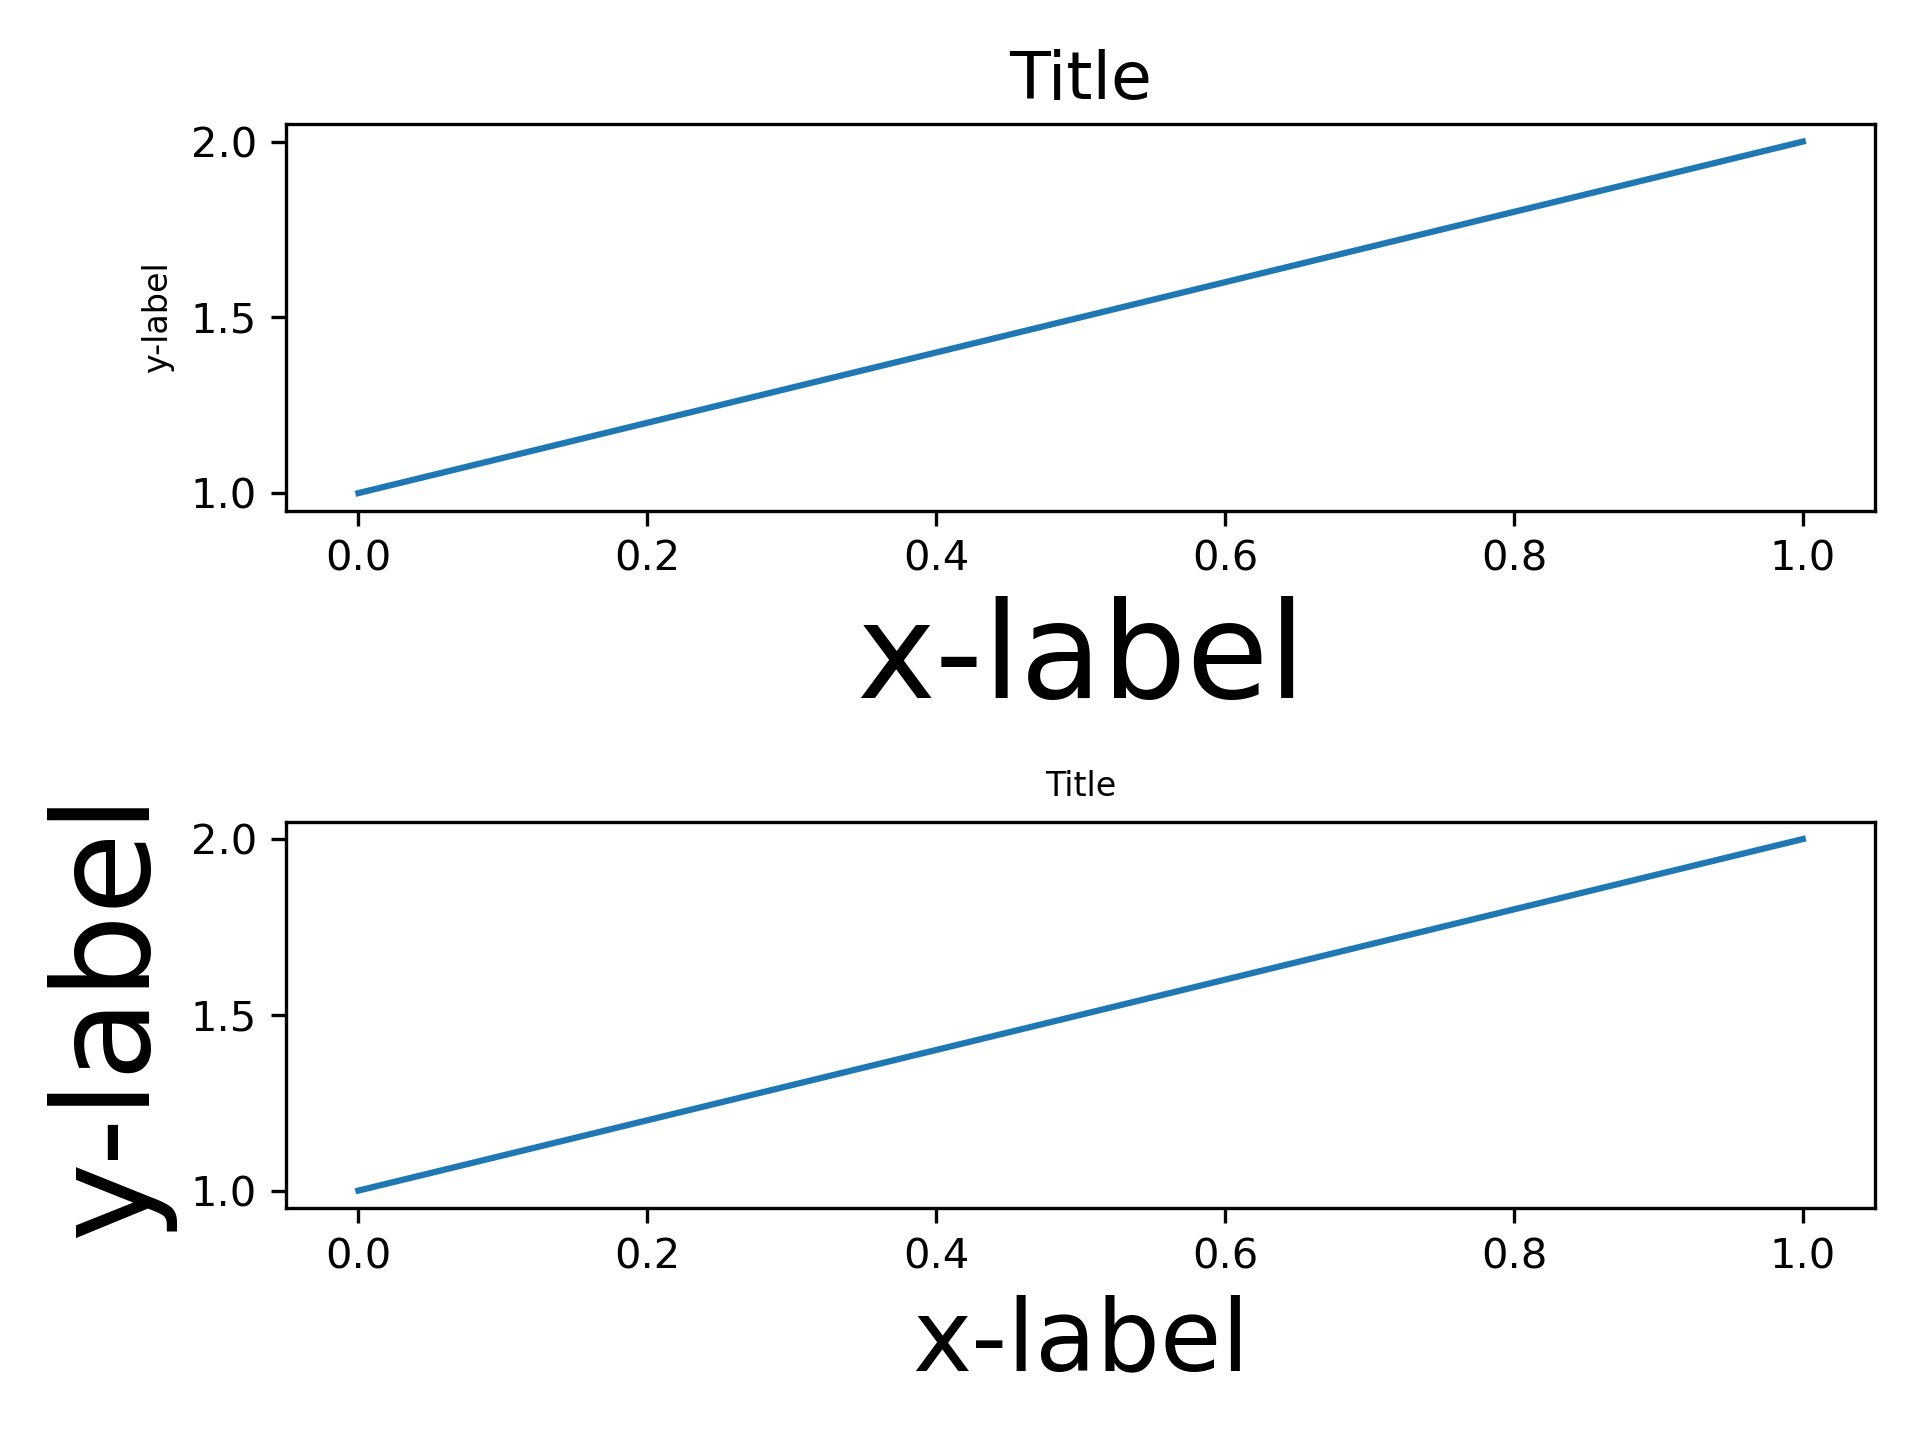
... fig, (ax1, ax2) = plt.subplots(nrows=2, ncols=1)
... example_plot(ax1)
... example_plot(ax2)
... fig.tight_layout()
...
... ###############################################################################
...
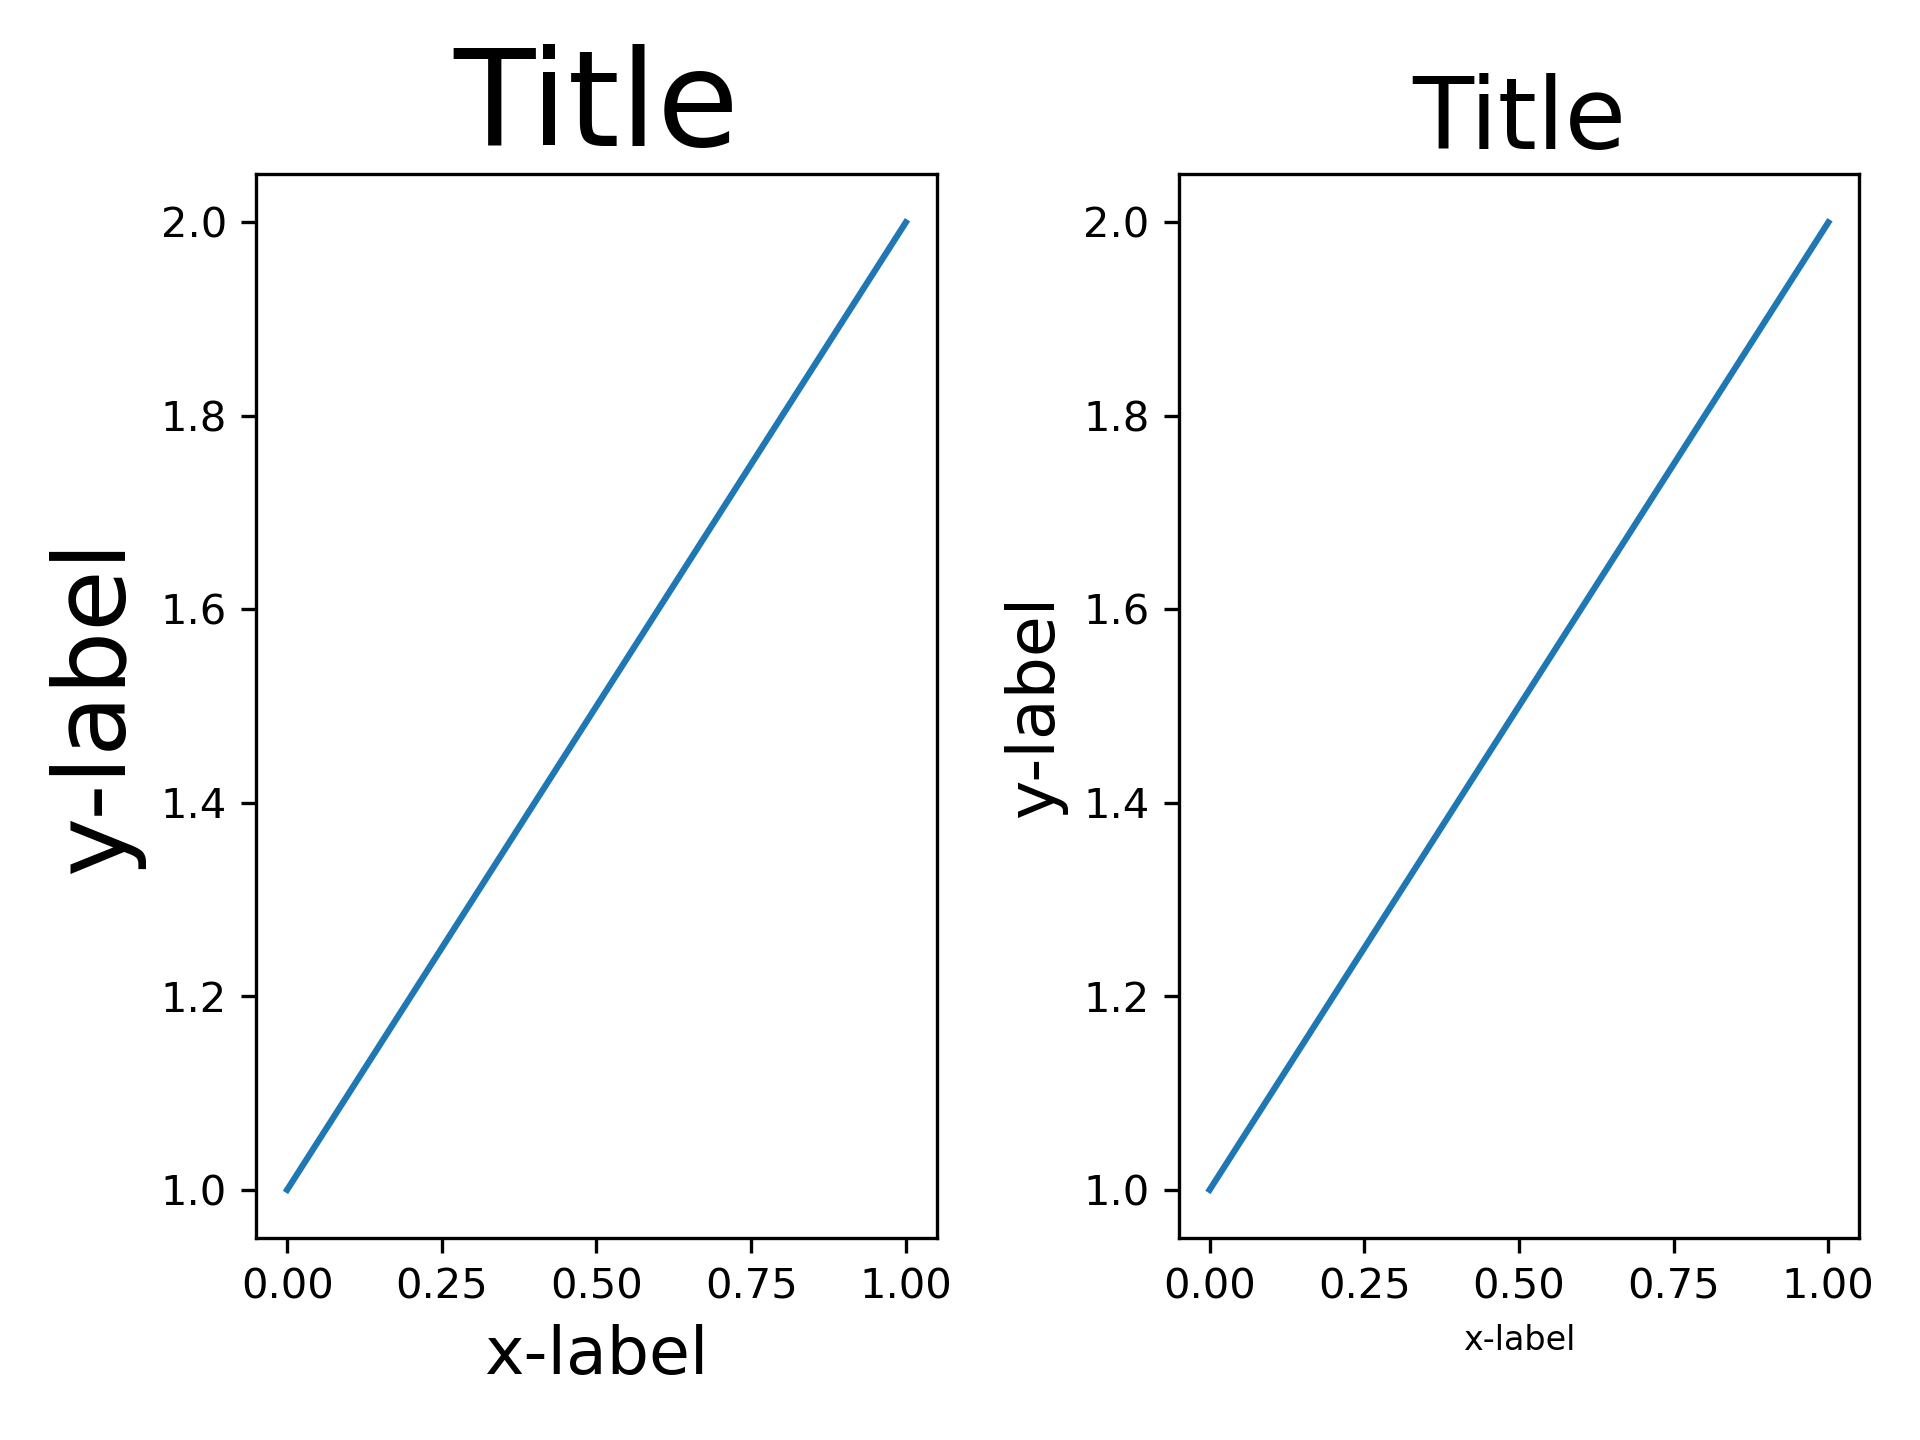
... fig, (ax1, ax2) = plt.subplots(nrows=1, ncols=2)
... example_plot(ax1)
... example_plot(ax2)
... fig.tight_layout()
...
... ###############################################################################
...
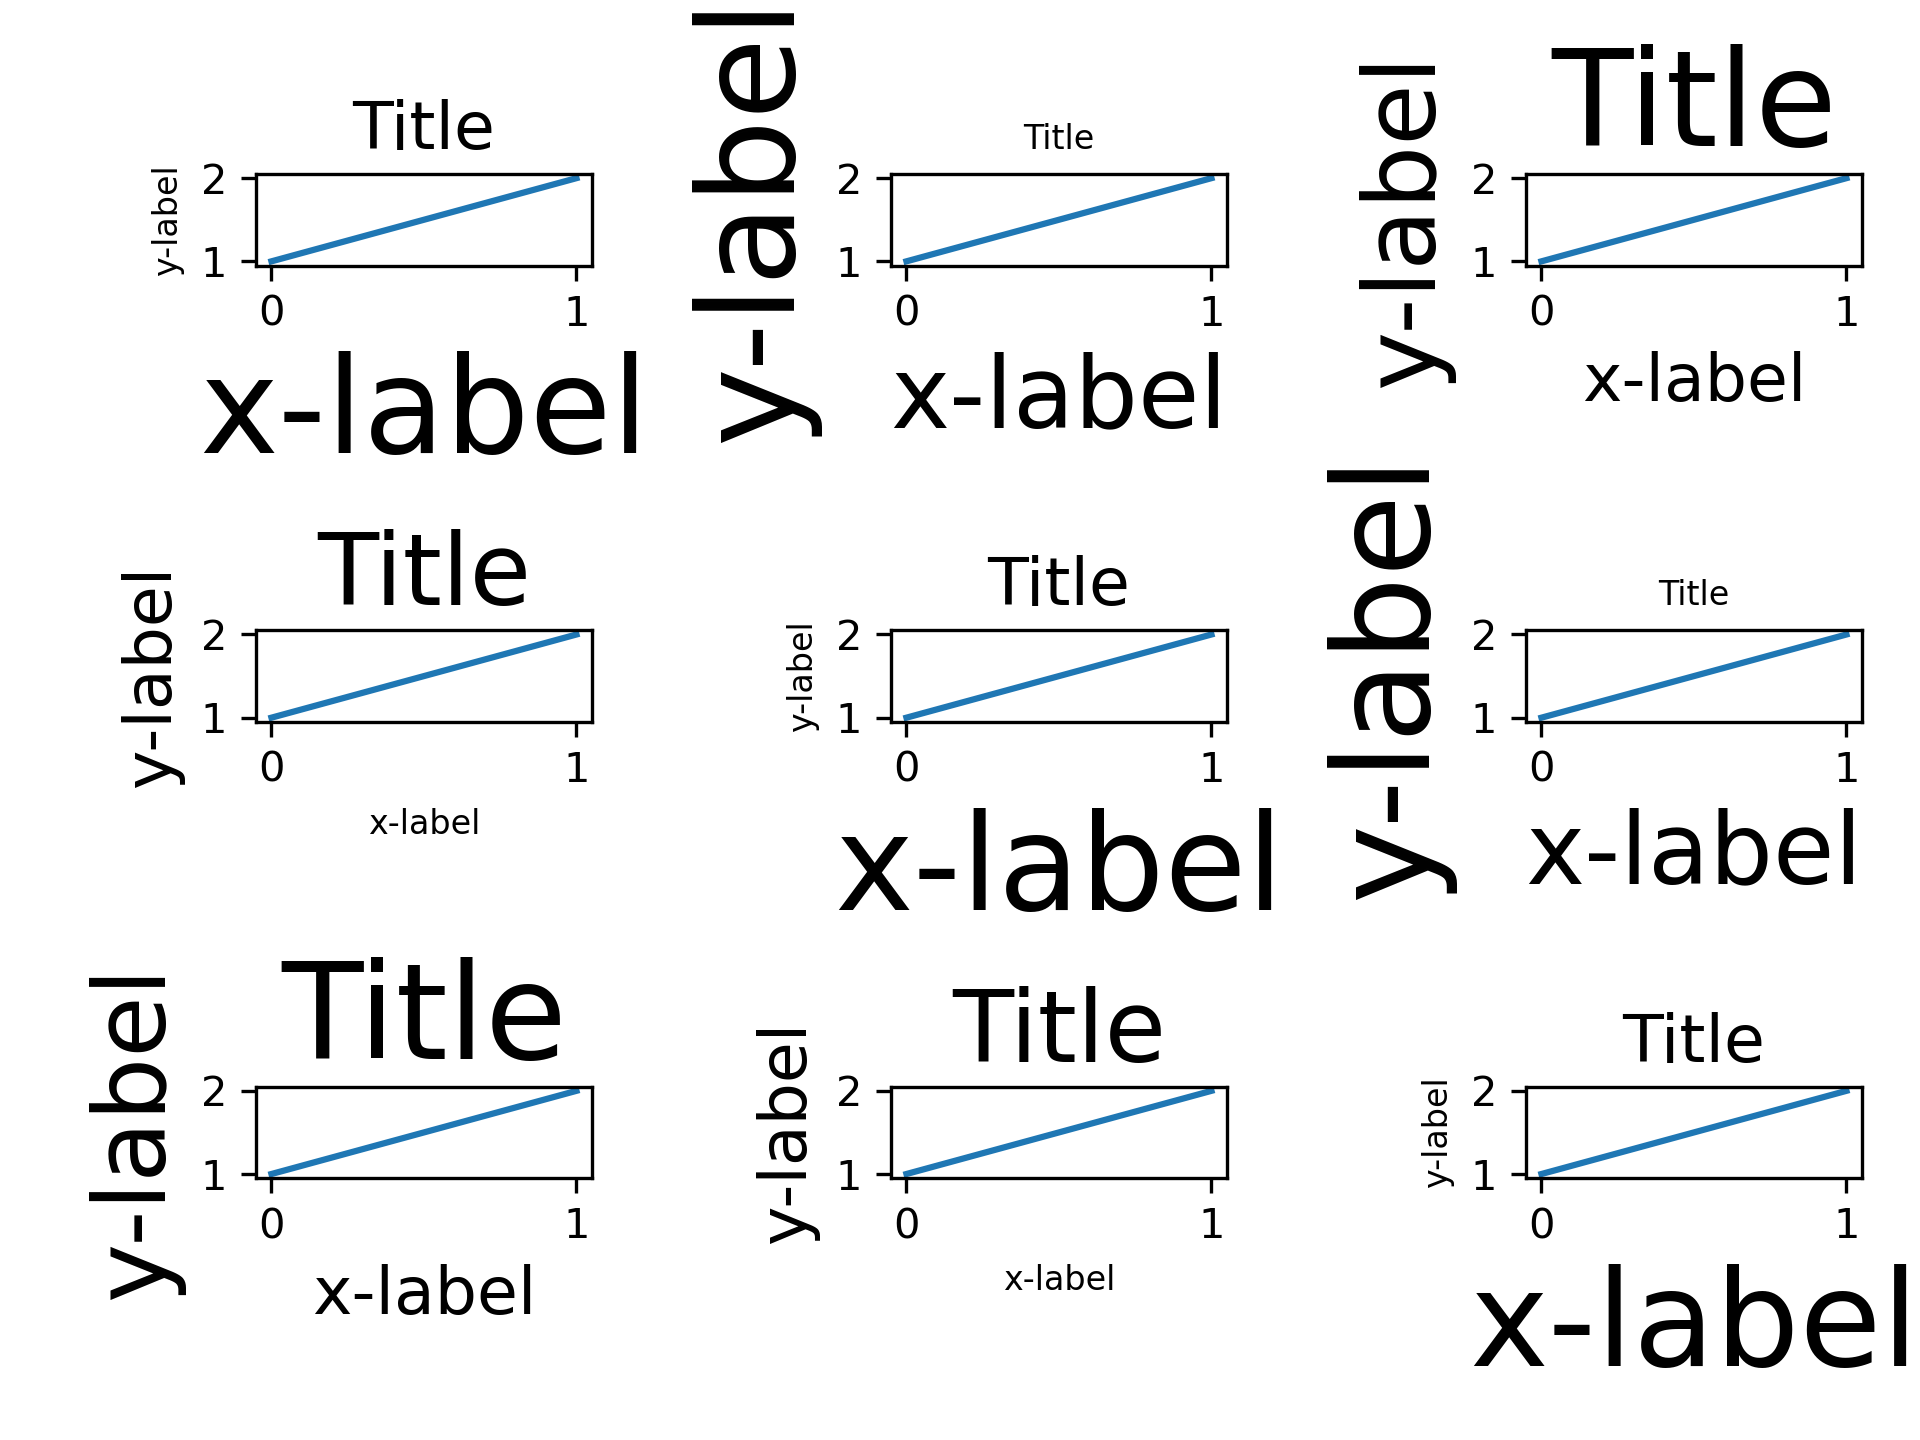
... fig, axs = plt.subplots(nrows=3, ncols=3)
... for ax in axs.flat:
... example_plot(ax)
... fig.tight_layout()
...
... ###############################################################################
...
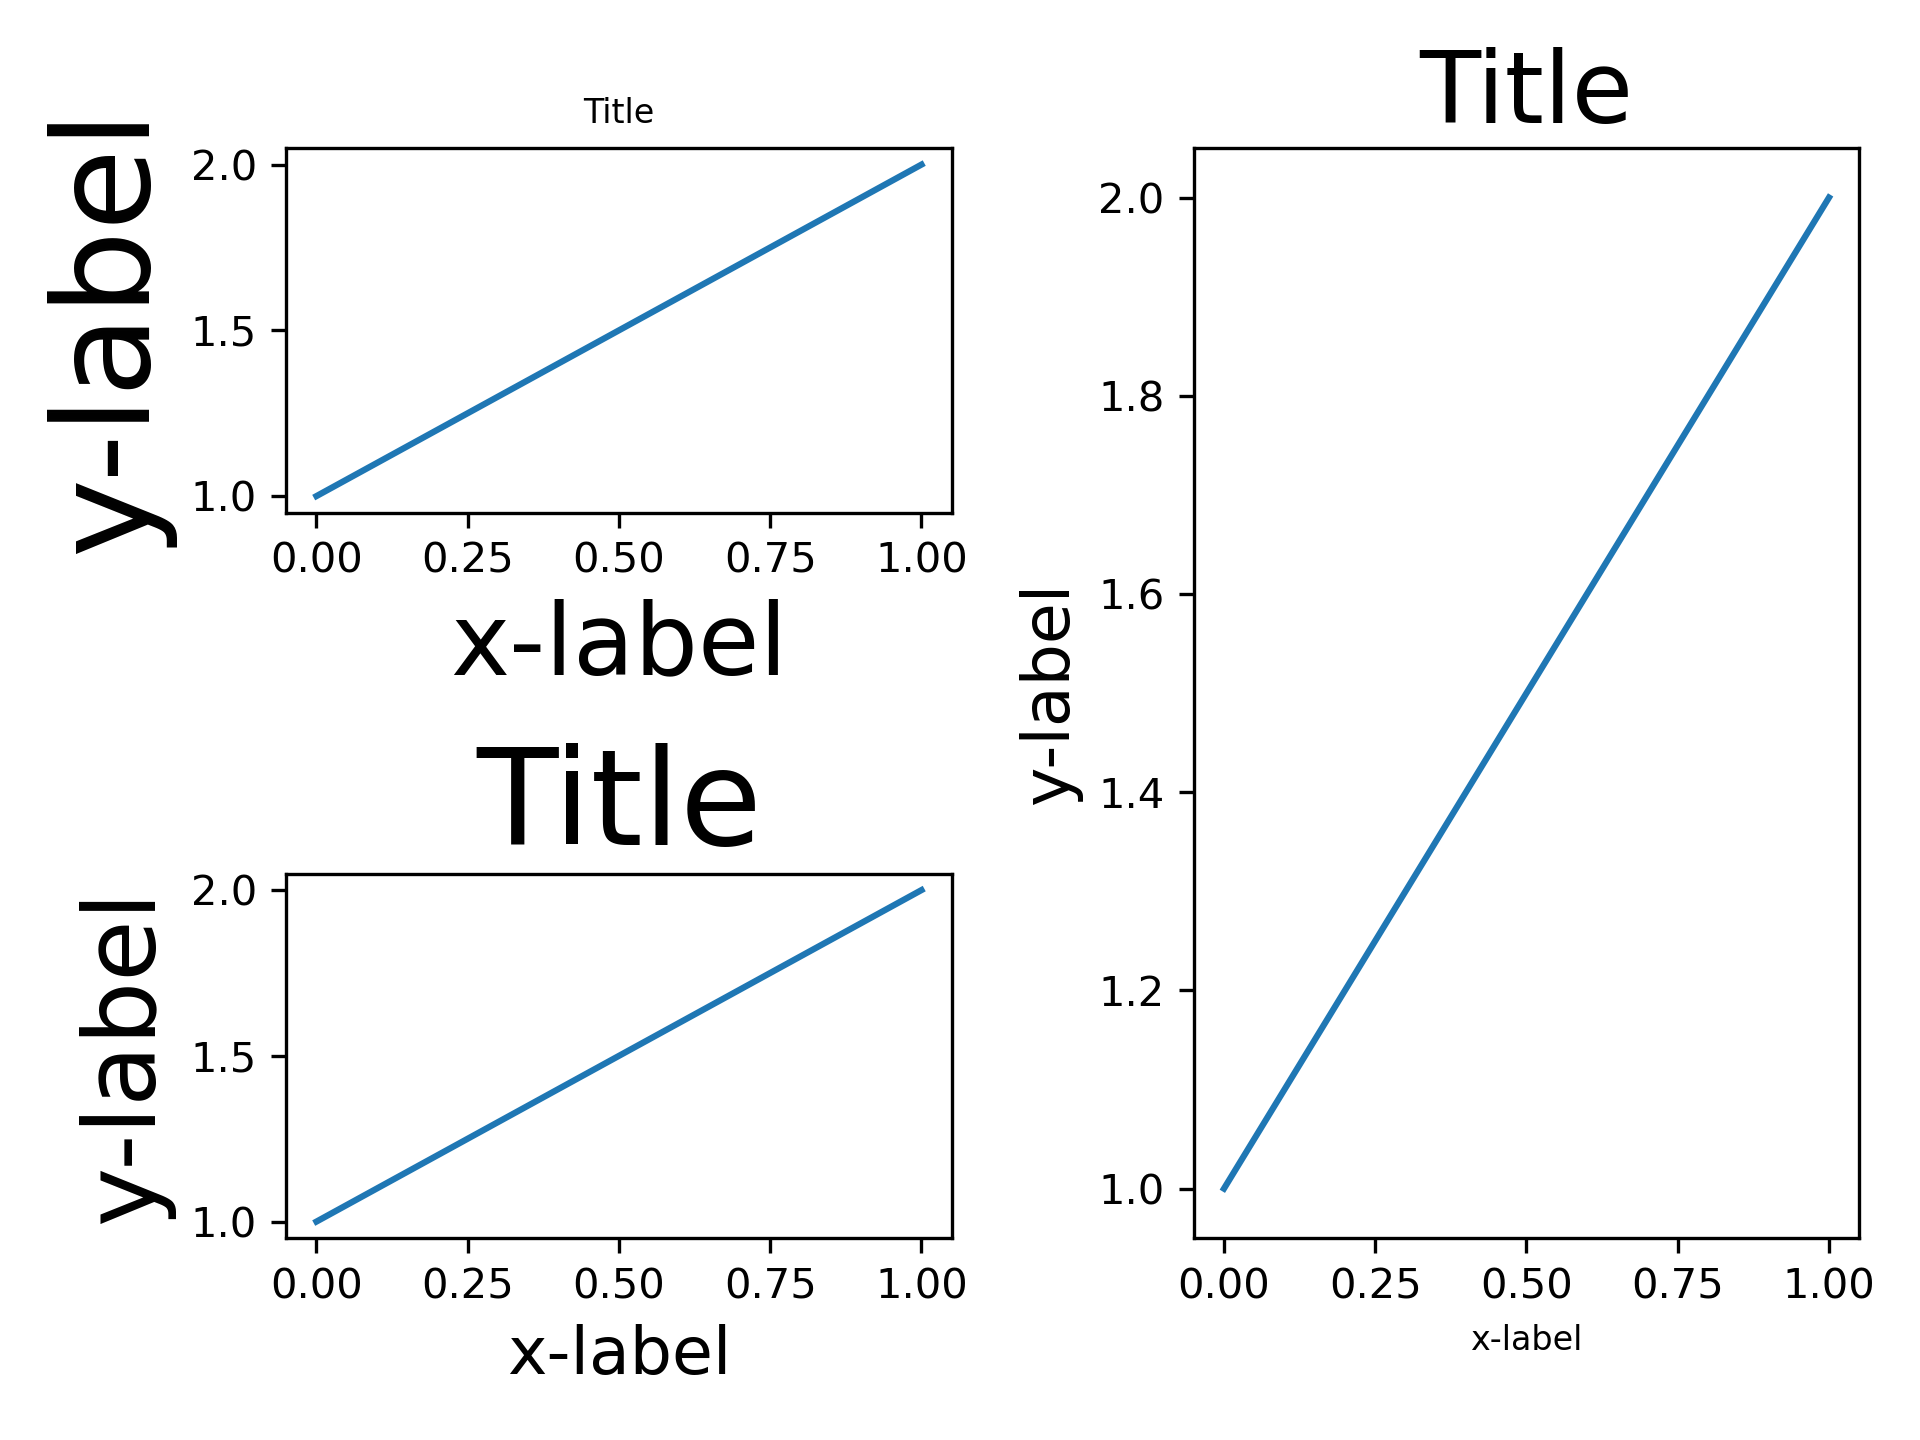
... plt.figure()
... ax1 = plt.subplot(221)
... ax2 = plt.subplot(223)
... ax3 = plt.subplot(122)
... example_plot(ax1)
... example_plot(ax2)
... example_plot(ax3)
... plt.tight_layout()
...
... ###############################################################################
...
... plt.figure()
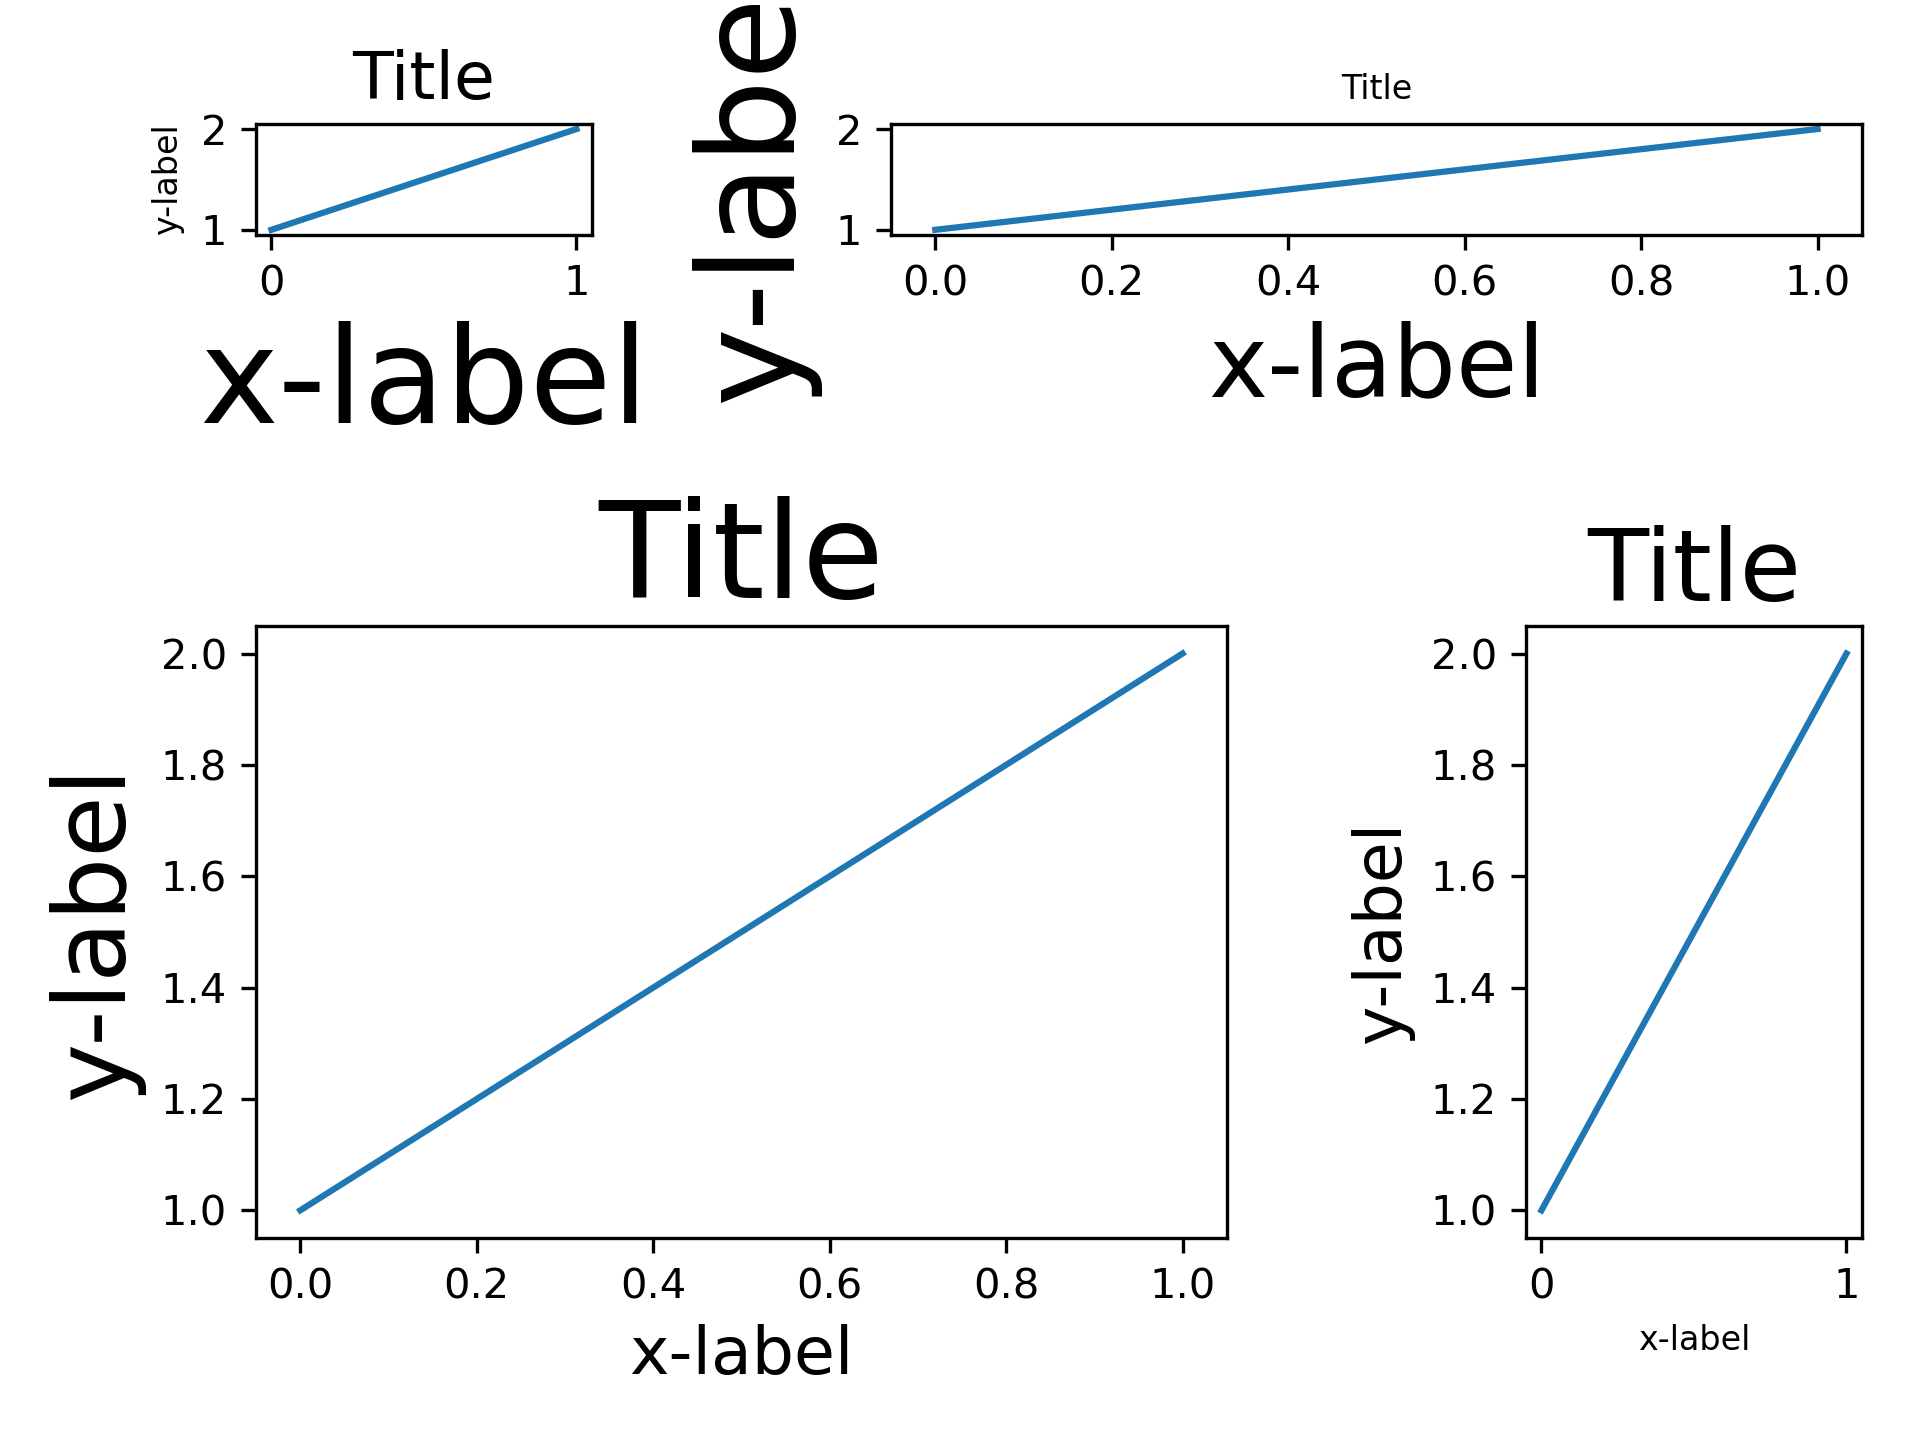
... ax1 = plt.subplot2grid((3, 3), (0, 0))
... ax2 = plt.subplot2grid((3, 3), (0, 1), colspan=2)
... ax3 = plt.subplot2grid((3, 3), (1, 0), colspan=2, rowspan=2)
... ax4 = plt.subplot2grid((3, 3), (1, 2), rowspan=2)
... example_plot(ax1)
... example_plot(ax2)
... example_plot(ax3)
... example_plot(ax4)
... plt.tight_layout()
...
... ###############################################################################
...
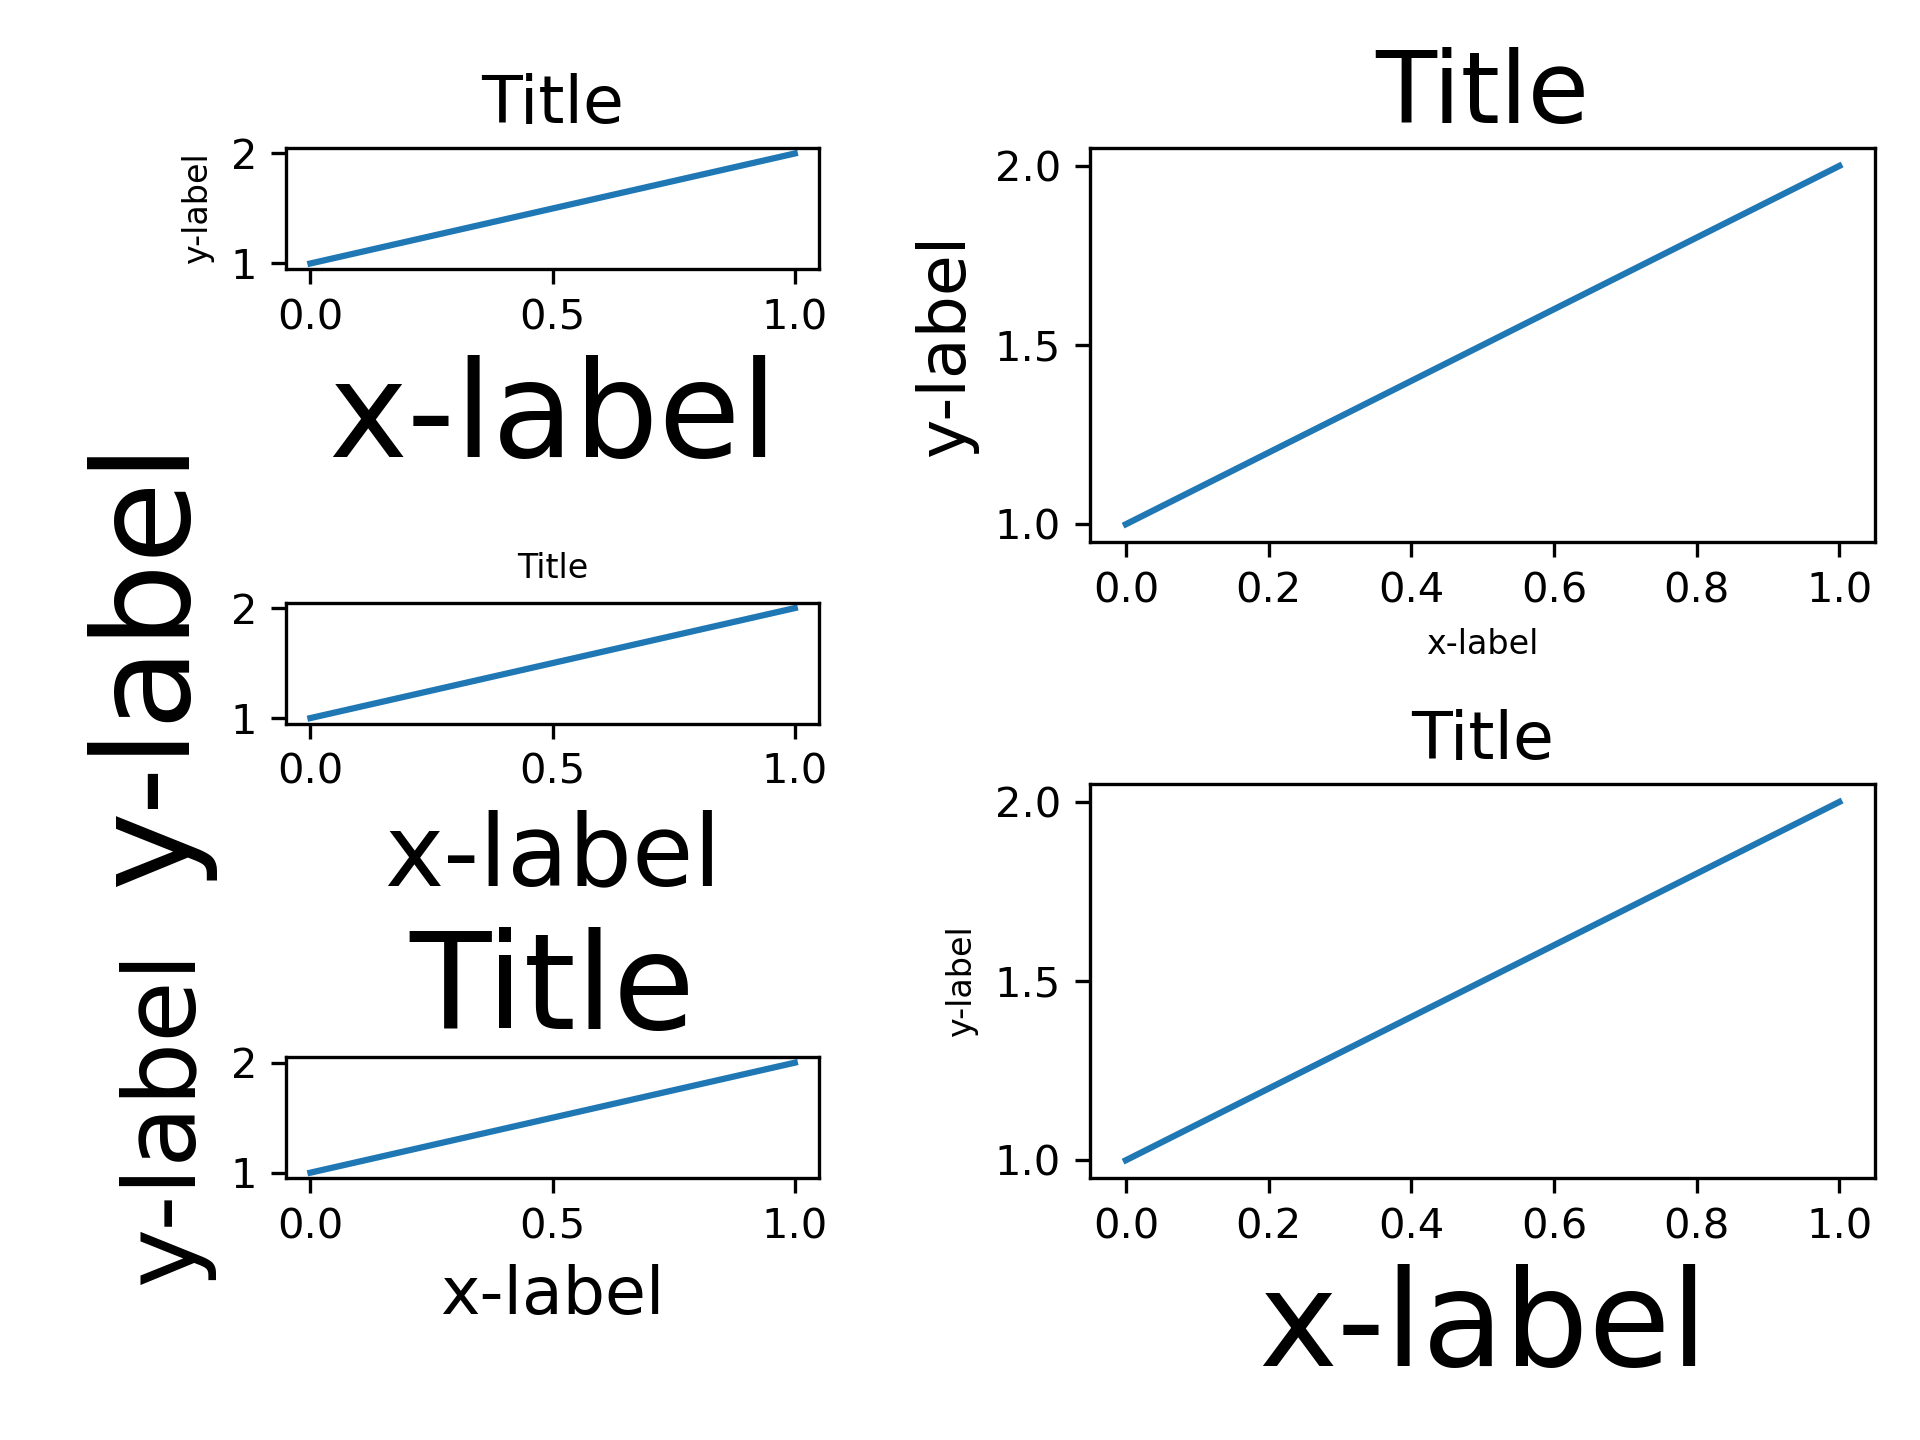
... fig = plt.figure()
...
... gs1 = fig.add_gridspec(3, 1)
... ax1 = fig.add_subplot(gs1[0])
... ax2 = fig.add_subplot(gs1[1])
... ax3 = fig.add_subplot(gs1[2])
... example_plot(ax1)
... example_plot(ax2)
... example_plot(ax3)
... gs1.tight_layout(fig, rect=[None, None, 0.45, None])
...
... gs2 = fig.add_gridspec(2, 1)
... ax4 = fig.add_subplot(gs2[0])
... ax5 = fig.add_subplot(gs2[1])
... example_plot(ax4)
... example_plot(ax5)
... with warnings.catch_warnings():
... # gs2.tight_layout cannot handle the subplots from the first gridspec
... # (gs1), so it will raise a warning. We are going to match the gridspecs
... # manually so we can filter the warning away.
... warnings.simplefilter("ignore", UserWarning)
... gs2.tight_layout(fig, rect=[0.45, None, None, None])
...
... # now match the top and bottom of two gridspecs.
... top = min(gs1.top, gs2.top)
... bottom = max(gs1.bottom, gs2.bottom)
...
... gs1.update(top=top, bottom=bottom)
... gs2.update(top=top, bottom=bottom)
...
... plt.show()
...
... #############################################################################
... #
... # .. admonition:: References
... #
... # The use of the following functions, methods, classes and modules is shown
... # in this example:
... #
... # - `matplotlib.figure.Figure.tight_layout` /
... # `matplotlib.pyplot.tight_layout`
... # - `matplotlib.figure.Figure.add_gridspec`
... # - `matplotlib.figure.Figure.add_subplot`
... # - `matplotlib.pyplot.subplot2grid`
...