>>> """
=============
GridSpec demo
=============
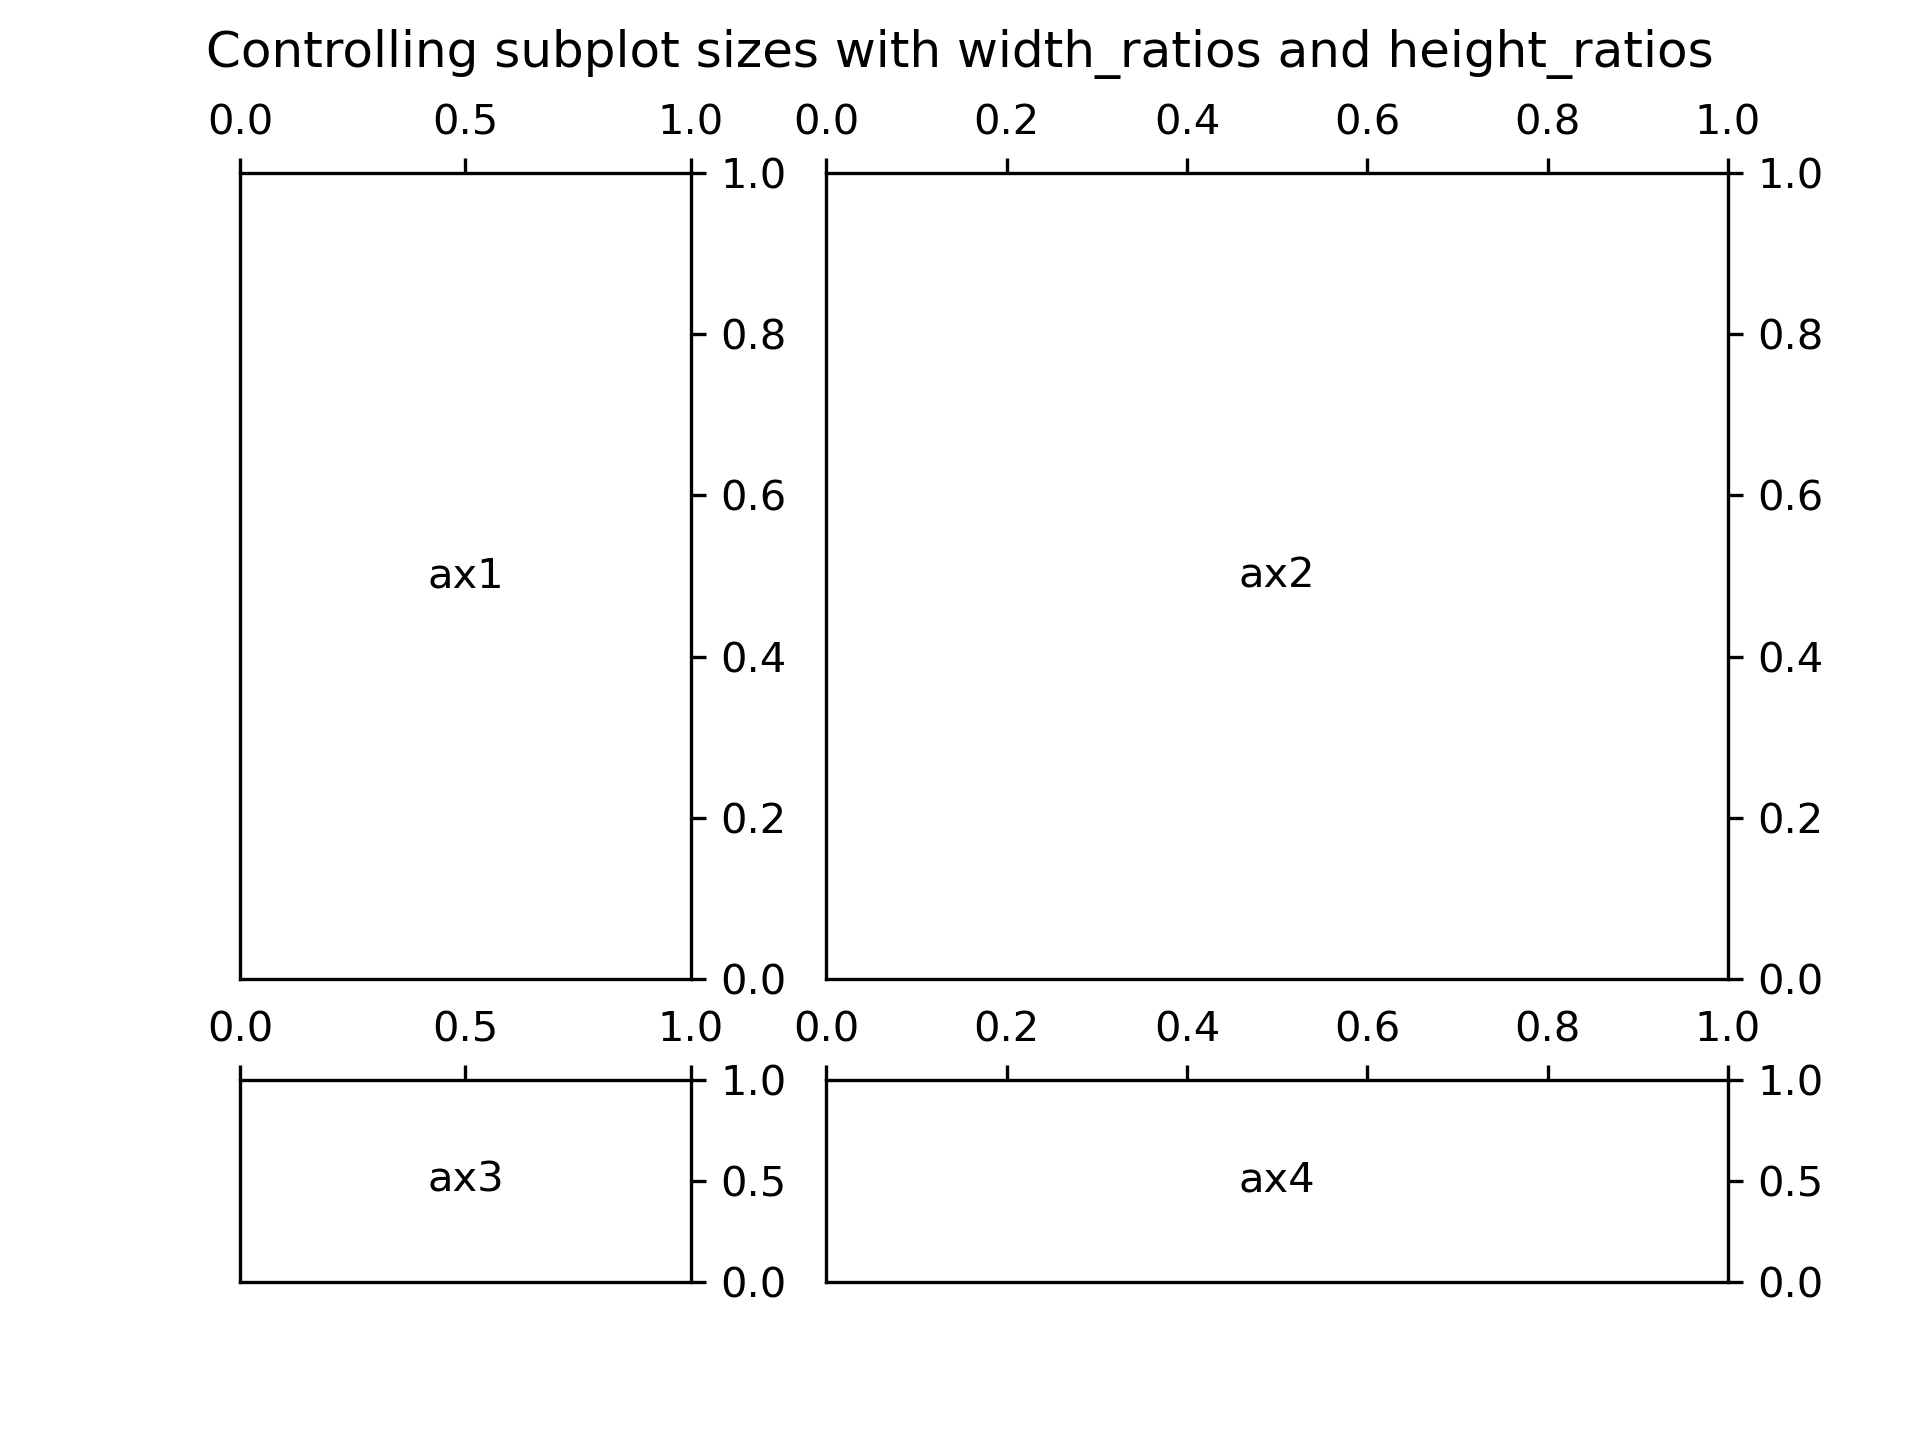
This example demonstrates the use of `.GridSpec` to generate subplots,
the control of the relative sizes of subplots with *width_ratios* and
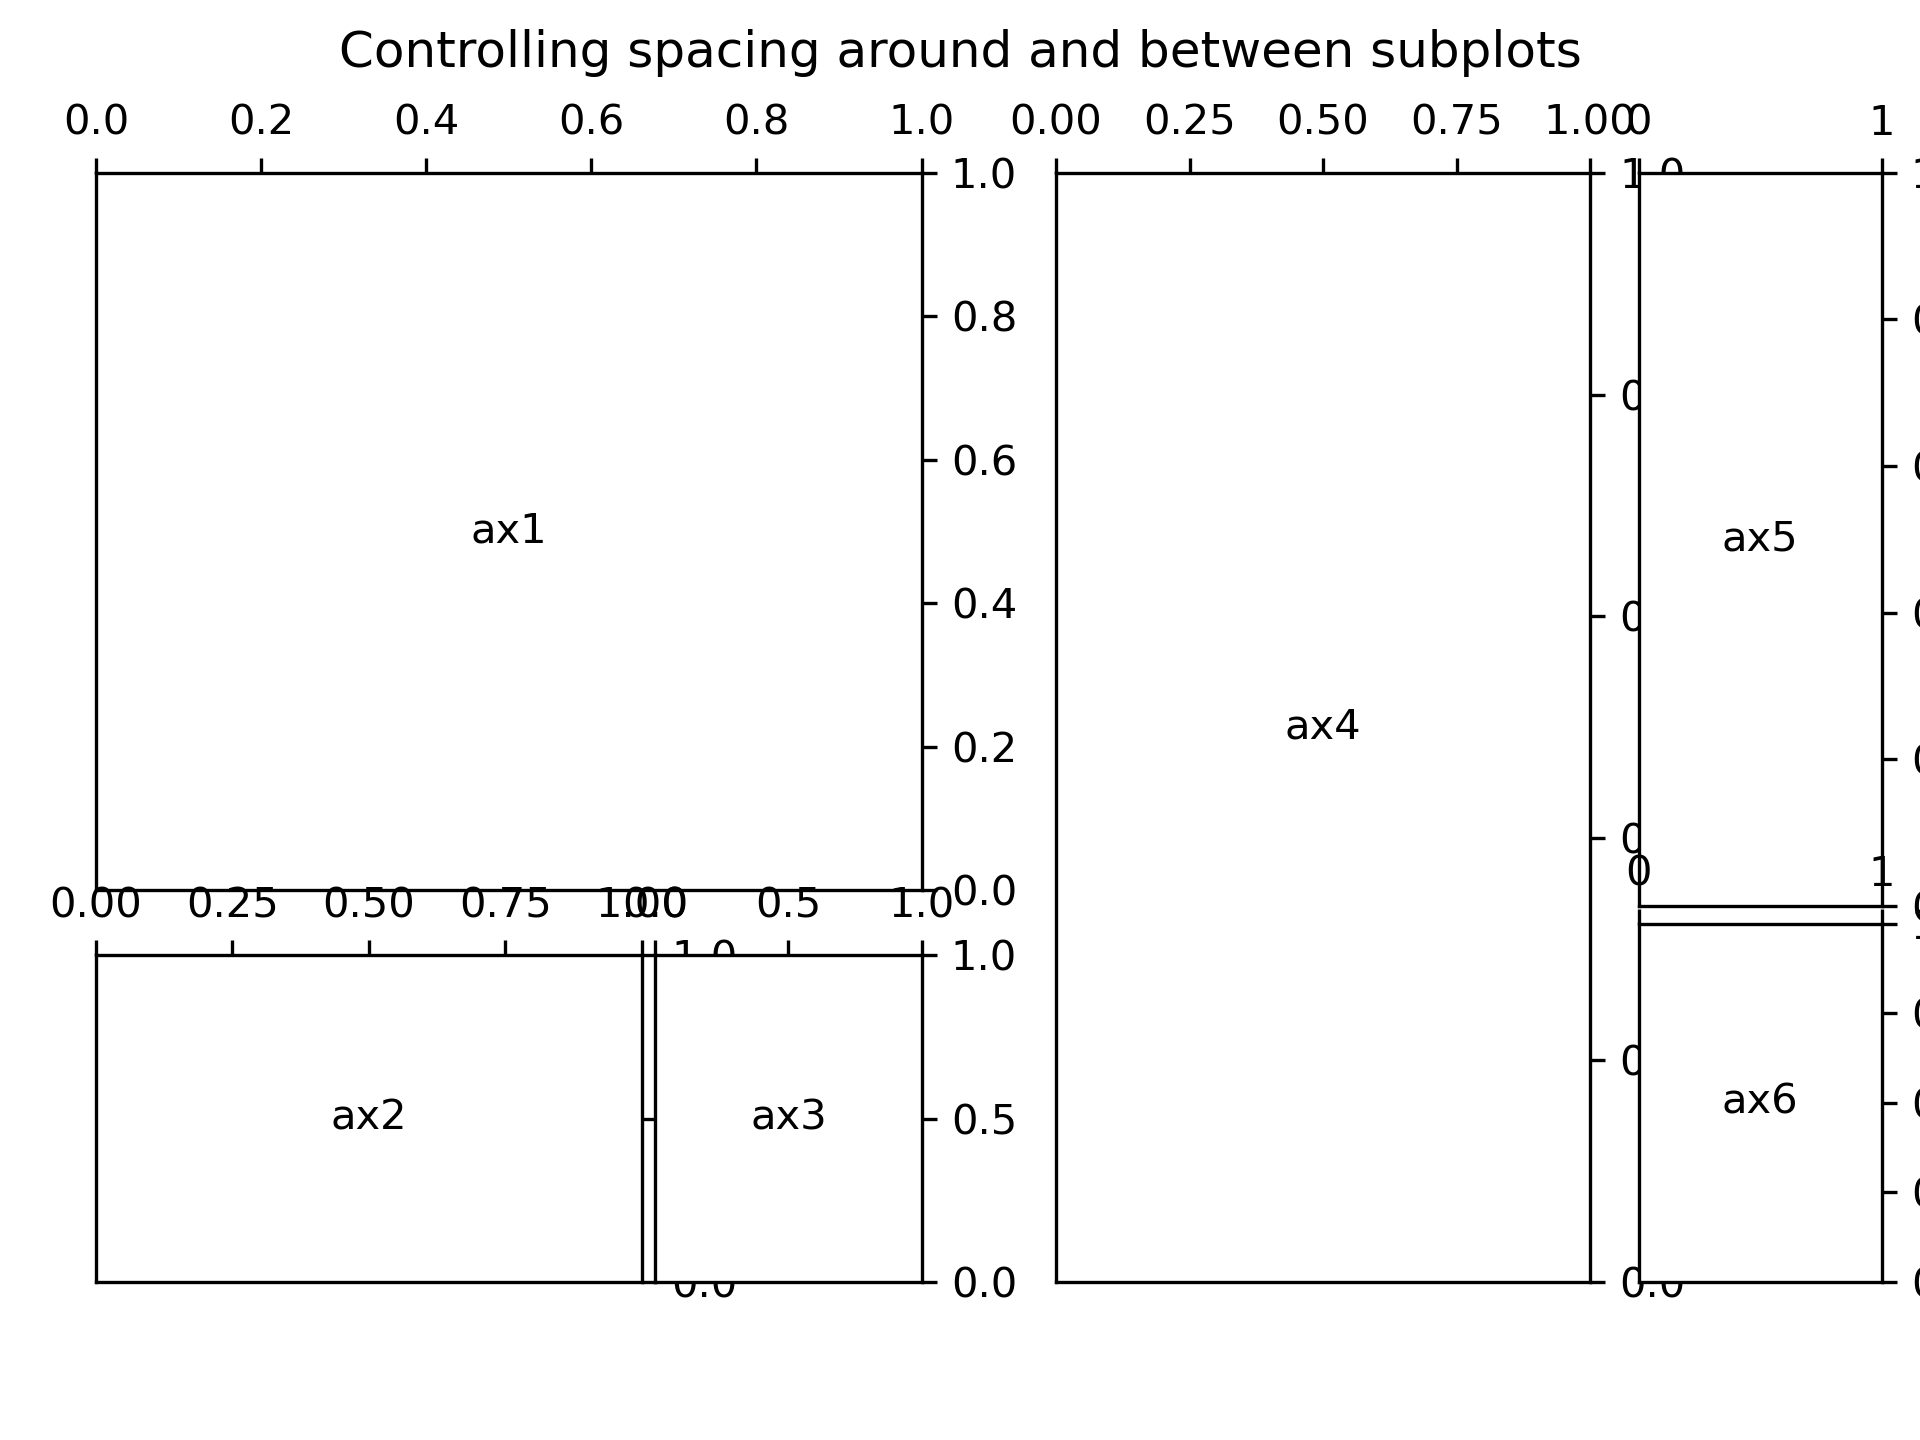
*height_ratios*, and the control of the spacing around and between subplots
using subplot params (*left*, *right*, *bottom*, *top*, *wspace*, and
*hspace*).
"""
...
... import matplotlib.pyplot as plt
... from matplotlib.gridspec import GridSpec
...
...
... def annotate_axes(fig):
... for i, ax in enumerate(fig.axes):
... ax.text(0.5, 0.5, "ax%d" % (i+1), va="center", ha="center")
... ax.tick_params(labelbottom=False, labelleft=False)
...
...
... fig = plt.figure()
... fig.suptitle("Controlling subplot sizes with width_ratios and height_ratios")
...
... gs = GridSpec(2, 2, width_ratios=[1, 2], height_ratios=[4, 1])
... ax1 = fig.add_subplot(gs[0])
... ax2 = fig.add_subplot(gs[1])
... ax3 = fig.add_subplot(gs[2])
... ax4 = fig.add_subplot(gs[3])
...
... annotate_axes(fig)
...
... #############################################################################
...
... fig = plt.figure()
... fig.suptitle("Controlling spacing around and between subplots")
...
... gs1 = GridSpec(3, 3, left=0.05, right=0.48, wspace=0.05)
... ax1 = fig.add_subplot(gs1[:-1, :])
... ax2 = fig.add_subplot(gs1[-1, :-1])
... ax3 = fig.add_subplot(gs1[-1, -1])
...
... gs2 = GridSpec(3, 3, left=0.55, right=0.98, hspace=0.05)
... ax4 = fig.add_subplot(gs2[:, :-1])
... ax5 = fig.add_subplot(gs2[:-1, -1])
... ax6 = fig.add_subplot(gs2[-1, -1])
...
... annotate_axes(fig)
...
... plt.show()
...