>>> """
=================
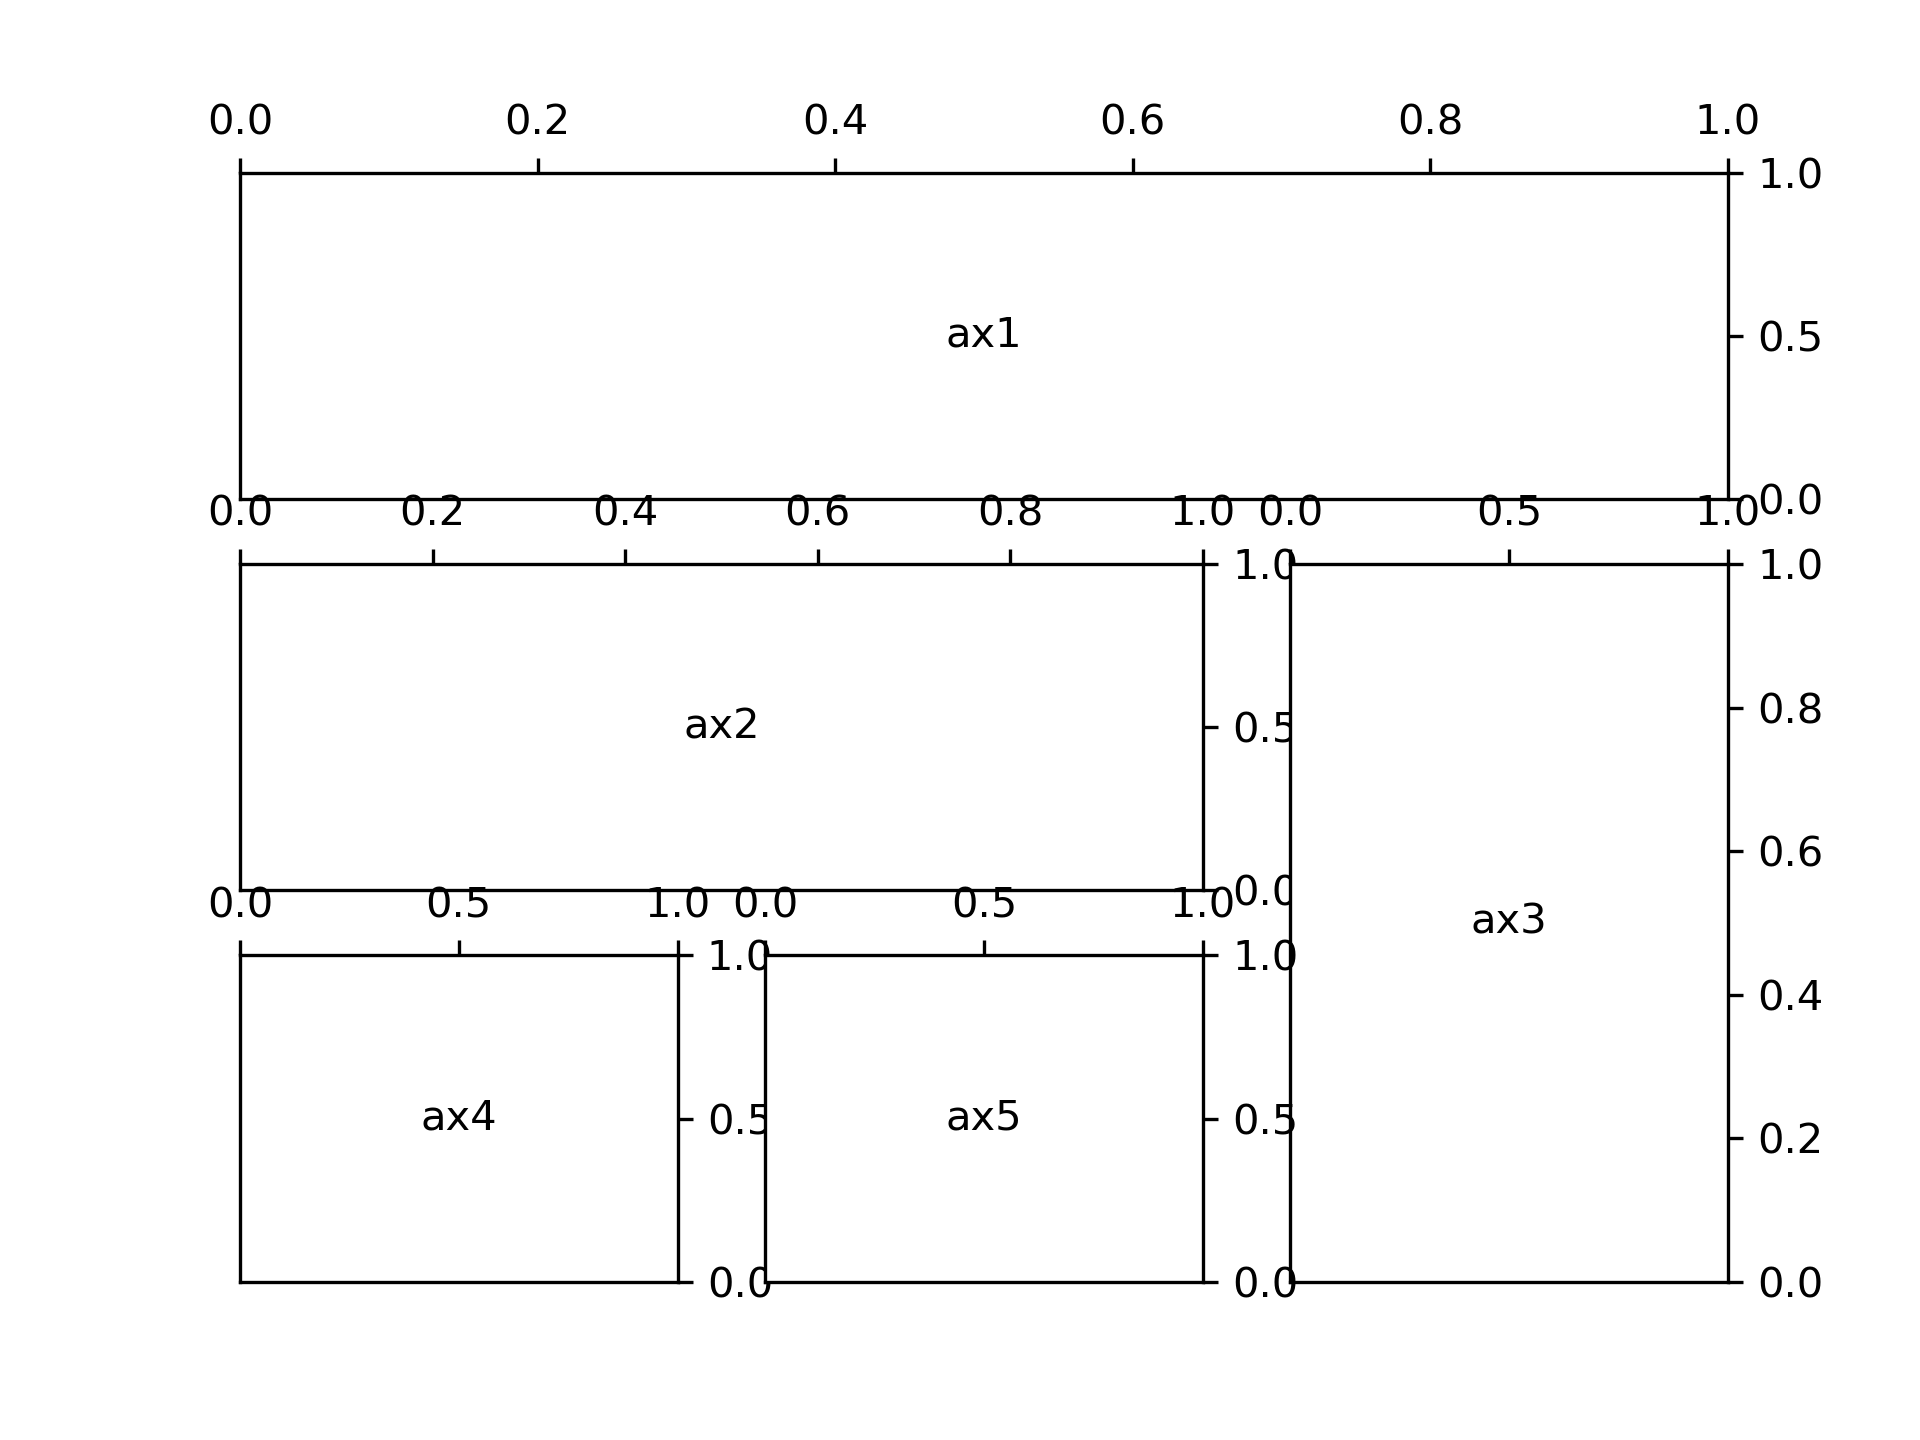
subplot2grid demo
=================
This example demonstrates the use of `.pyplot.subplot2grid` to generate
subplots. Using `.GridSpec`, as demonstrated in
:doc:`/gallery/userdemo/demo_gridspec03` is generally preferred.
"""
...
... import matplotlib.pyplot as plt
...
...
... def annotate_axes(fig):
... for i, ax in enumerate(fig.axes):
... ax.text(0.5, 0.5, "ax%d" % (i+1), va="center", ha="center")
... ax.tick_params(labelbottom=False, labelleft=False)
...
...
... fig = plt.figure()
... ax1 = plt.subplot2grid((3, 3), (0, 0), colspan=3)
... ax2 = plt.subplot2grid((3, 3), (1, 0), colspan=2)
... ax3 = plt.subplot2grid((3, 3), (1, 2), rowspan=2)
... ax4 = plt.subplot2grid((3, 3), (2, 0))
... ax5 = plt.subplot2grid((3, 3), (2, 1))
...
... annotate_axes(fig)
...
... plt.show()
...