>>> """
===============================
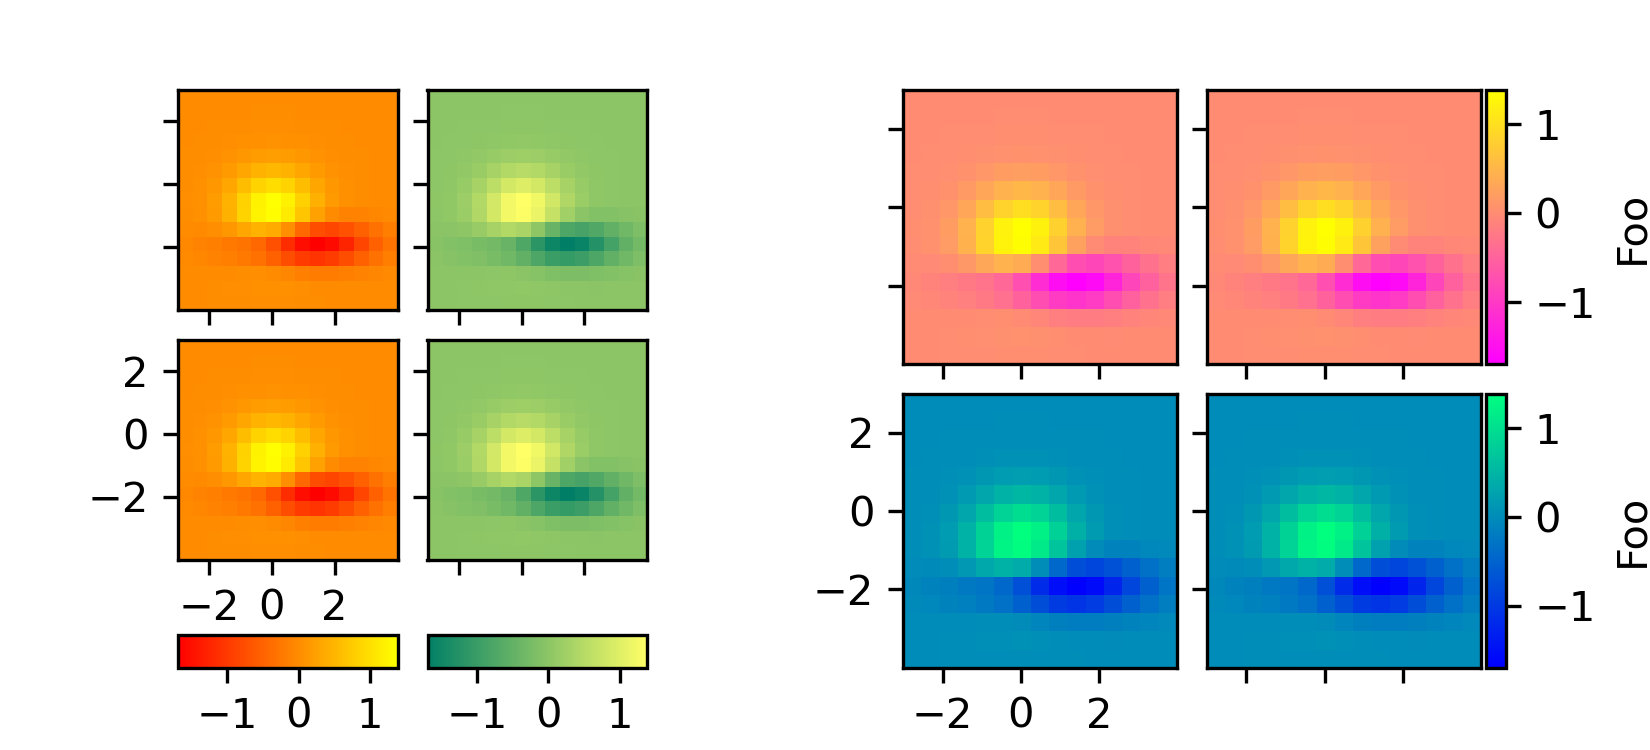
Per-row or per-column colorbars
===============================
This example shows how to use one common colorbar for each row or column
of an image grid.
"""
...
... from matplotlib import cbook
... import matplotlib.pyplot as plt
... from mpl_toolkits.axes_grid1 import AxesGrid
...
...
... def get_demo_image():
... z = cbook.get_sample_data("axes_grid/bivariate_normal.npy", np_load=True)
... # z is a numpy array of 15x15
... return z, (-3, 4, -4, 3)
...
...
... def demo_bottom_cbar(fig):
... """
A grid of 2x2 images with a colorbar for each column.
"""
... grid = AxesGrid(fig, 121, # similar to subplot(121)
... nrows_ncols=(2, 2),
... axes_pad=0.10,
... share_all=True,
... label_mode="1",
... cbar_location="bottom",
... cbar_mode="edge",
... cbar_pad=0.25,
... cbar_size="15%",
... direction="column"
... )
...
... Z, extent = get_demo_image()
... cmaps = ["autumn", "summer"]
... for i in range(4):
... im = grid[i].imshow(Z, extent=extent, cmap=cmaps[i//2])
... if i % 2:
... grid.cbar_axes[i//2].colorbar(im)
...
... for cax in grid.cbar_axes:
... cax.toggle_label(True)
... cax.axis[cax.orientation].set_label("Bar")
...
... # This affects all axes as share_all = True.
... grid.axes_llc.set_xticks([-2, 0, 2])
... grid.axes_llc.set_yticks([-2, 0, 2])
...
...
... def demo_right_cbar(fig):
... """
A grid of 2x2 images. Each row has its own colorbar.
"""
... grid = AxesGrid(fig, 122, # similar to subplot(122)
... nrows_ncols=(2, 2),
... axes_pad=0.10,
... label_mode="1",
... share_all=True,
... cbar_location="right",
... cbar_mode="edge",
... cbar_size="7%",
... cbar_pad="2%",
... )
... Z, extent = get_demo_image()
... cmaps = ["spring", "winter"]
... for i in range(4):
... im = grid[i].imshow(Z, extent=extent, cmap=cmaps[i//2])
... if i % 2:
... grid.cbar_axes[i//2].colorbar(im)
...
... for cax in grid.cbar_axes:
... cax.toggle_label(True)
... cax.axis[cax.orientation].set_label('Foo')
...
... # This affects all axes because we set share_all = True.
... grid.axes_llc.set_xticks([-2, 0, 2])
... grid.axes_llc.set_yticks([-2, 0, 2])
...
...
... fig = plt.figure(figsize=(5.5, 2.5))
... fig.subplots_adjust(left=0.05, right=0.93)
...
... demo_bottom_cbar(fig)
... demo_right_cbar(fig)
...
... plt.show()
...