>>> """
==========
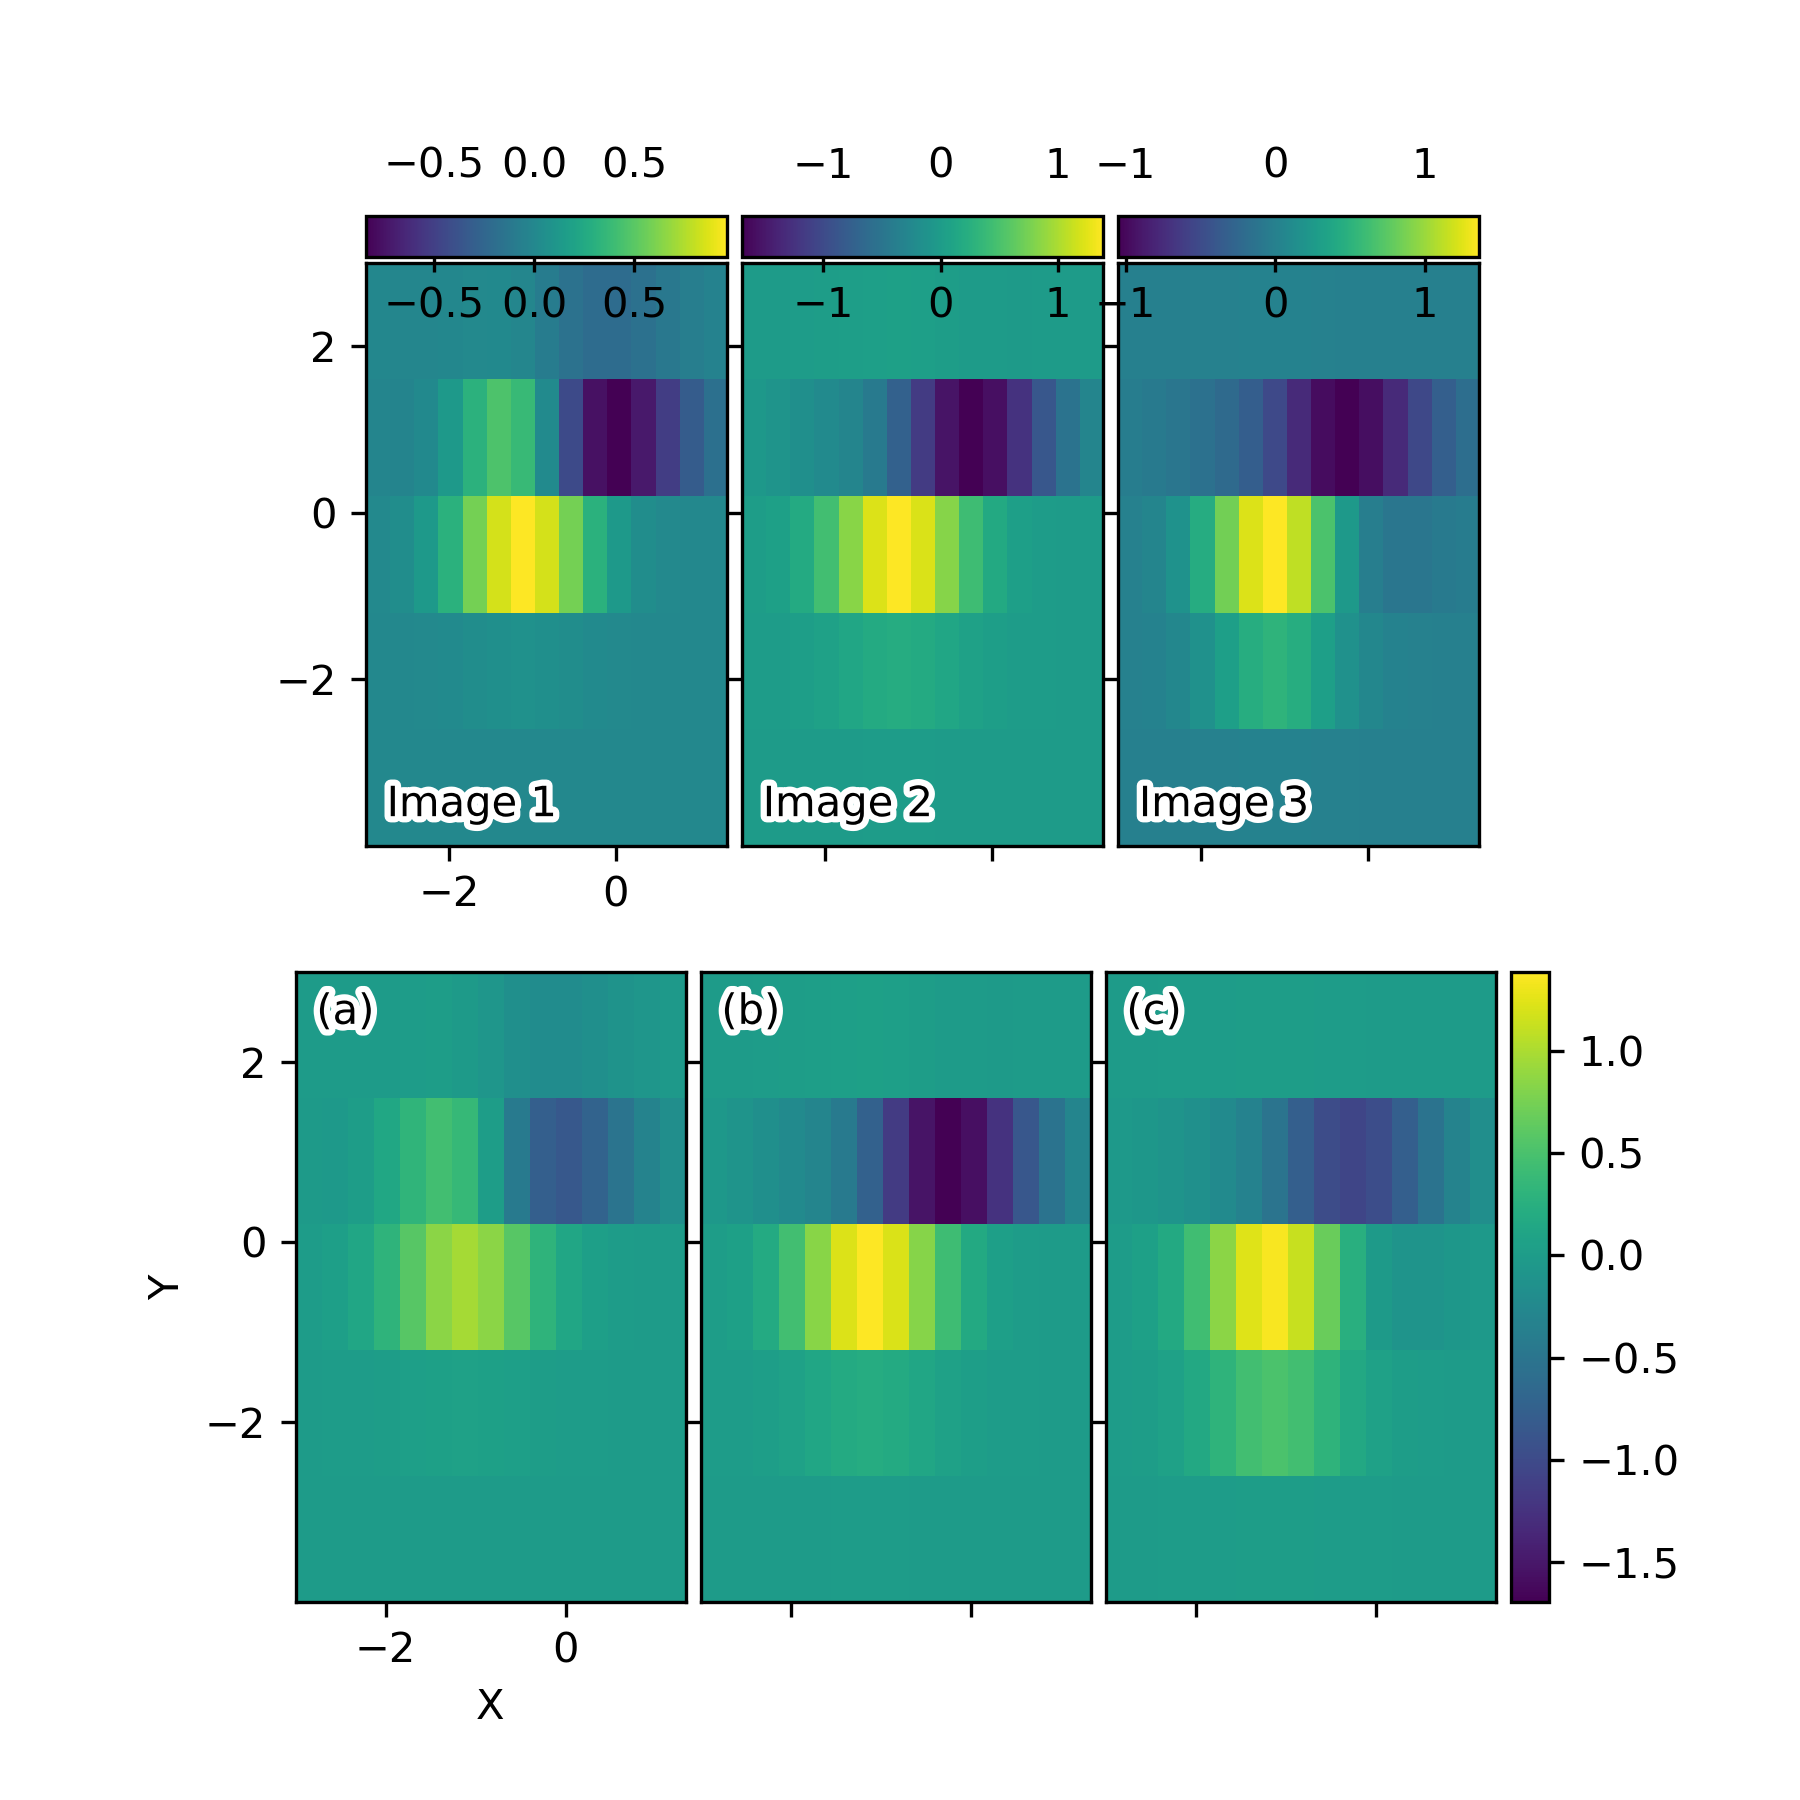
Axes Grid2
==========
Grid of images with shared xaxis and yaxis.
"""
...
... import numpy as np
... from matplotlib import cbook
... import matplotlib.colors
... import matplotlib.pyplot as plt
... from mpl_toolkits.axes_grid1 import ImageGrid
...
...
... def add_inner_title(ax, title, loc, **kwargs):
... from matplotlib.offsetbox import AnchoredText
... from matplotlib.patheffects import withStroke
... prop = dict(path_effects=[withStroke(foreground='w', linewidth=3)],
... size=plt.rcParams['legend.fontsize'])
... at = AnchoredText(title, loc=loc, prop=prop,
... pad=0., borderpad=0.5,
... frameon=False, **kwargs)
... ax.add_artist(at)
... return at
...
...
... fig = plt.figure(figsize=(6, 6))
...
... # Prepare images
... Z = cbook.get_sample_data("axes_grid/bivariate_normal.npy", np_load=True)
... extent = (-3, 4, -4, 3)
... ZS = [Z[i::3, :] for i in range(3)]
... extent = extent[0], extent[1]/3., extent[2], extent[3]
...
... # *** Demo 1: colorbar at each axes ***
... grid = ImageGrid(fig, 211, # similar to subplot(211)
... nrows_ncols=(1, 3),
... axes_pad=0.05,
... label_mode="1",
... share_all=True,
... cbar_location="top",
... cbar_mode="each",
... cbar_size="7%",
... cbar_pad="1%",
... )
...
... for i, (ax, z) in enumerate(zip(grid, ZS)):
... im = ax.imshow(z, origin="lower", extent=extent)
... cb = ax.cax.colorbar(im)
... # Changing the colorbar ticks
... if i in [1, 2]:
... cb.set_ticks([-1, 0, 1])
...
... for ax, im_title in zip(grid, ["Image 1", "Image 2", "Image 3"]):
... t = add_inner_title(ax, im_title, loc='lower left')
... t.patch.set_alpha(0.5)
...
... for ax, z in zip(grid, ZS):
... ax.cax.toggle_label(True)
...
... grid[0].set_xticks([-2, 0])
... grid[0].set_yticks([-2, 0, 2])
...
... # *** Demo 2: shared colorbar ***
... grid2 = ImageGrid(fig, 212,
... nrows_ncols=(1, 3),
... axes_pad=0.05,
... label_mode="1",
... share_all=True,
... cbar_location="right",
... cbar_mode="single",
... cbar_size="10%",
... cbar_pad=0.05,
... )
...
... grid2[0].set_xlabel("X")
... grid2[0].set_ylabel("Y")
...
... vmax, vmin = np.max(ZS), np.min(ZS)
... norm = matplotlib.colors.Normalize(vmax=vmax, vmin=vmin)
...
... for ax, z in zip(grid2, ZS):
... im = ax.imshow(z, norm=norm, origin="lower", extent=extent)
...
... # With cbar_mode="single", cax attribute of all axes are identical.
... ax.cax.colorbar(im)
... ax.cax.toggle_label(True)
...
... for ax, im_title in zip(grid2, ["(a)", "(b)", "(c)"]):
... t = add_inner_title(ax, im_title, loc='upper left')
... t.patch.set_ec("none")
... t.patch.set_alpha(0.5)
...
... grid2[0].set_xticks([-2, 0])
... grid2[0].set_yticks([-2, 0, 2])
...
... plt.show()
...