>>> """
============
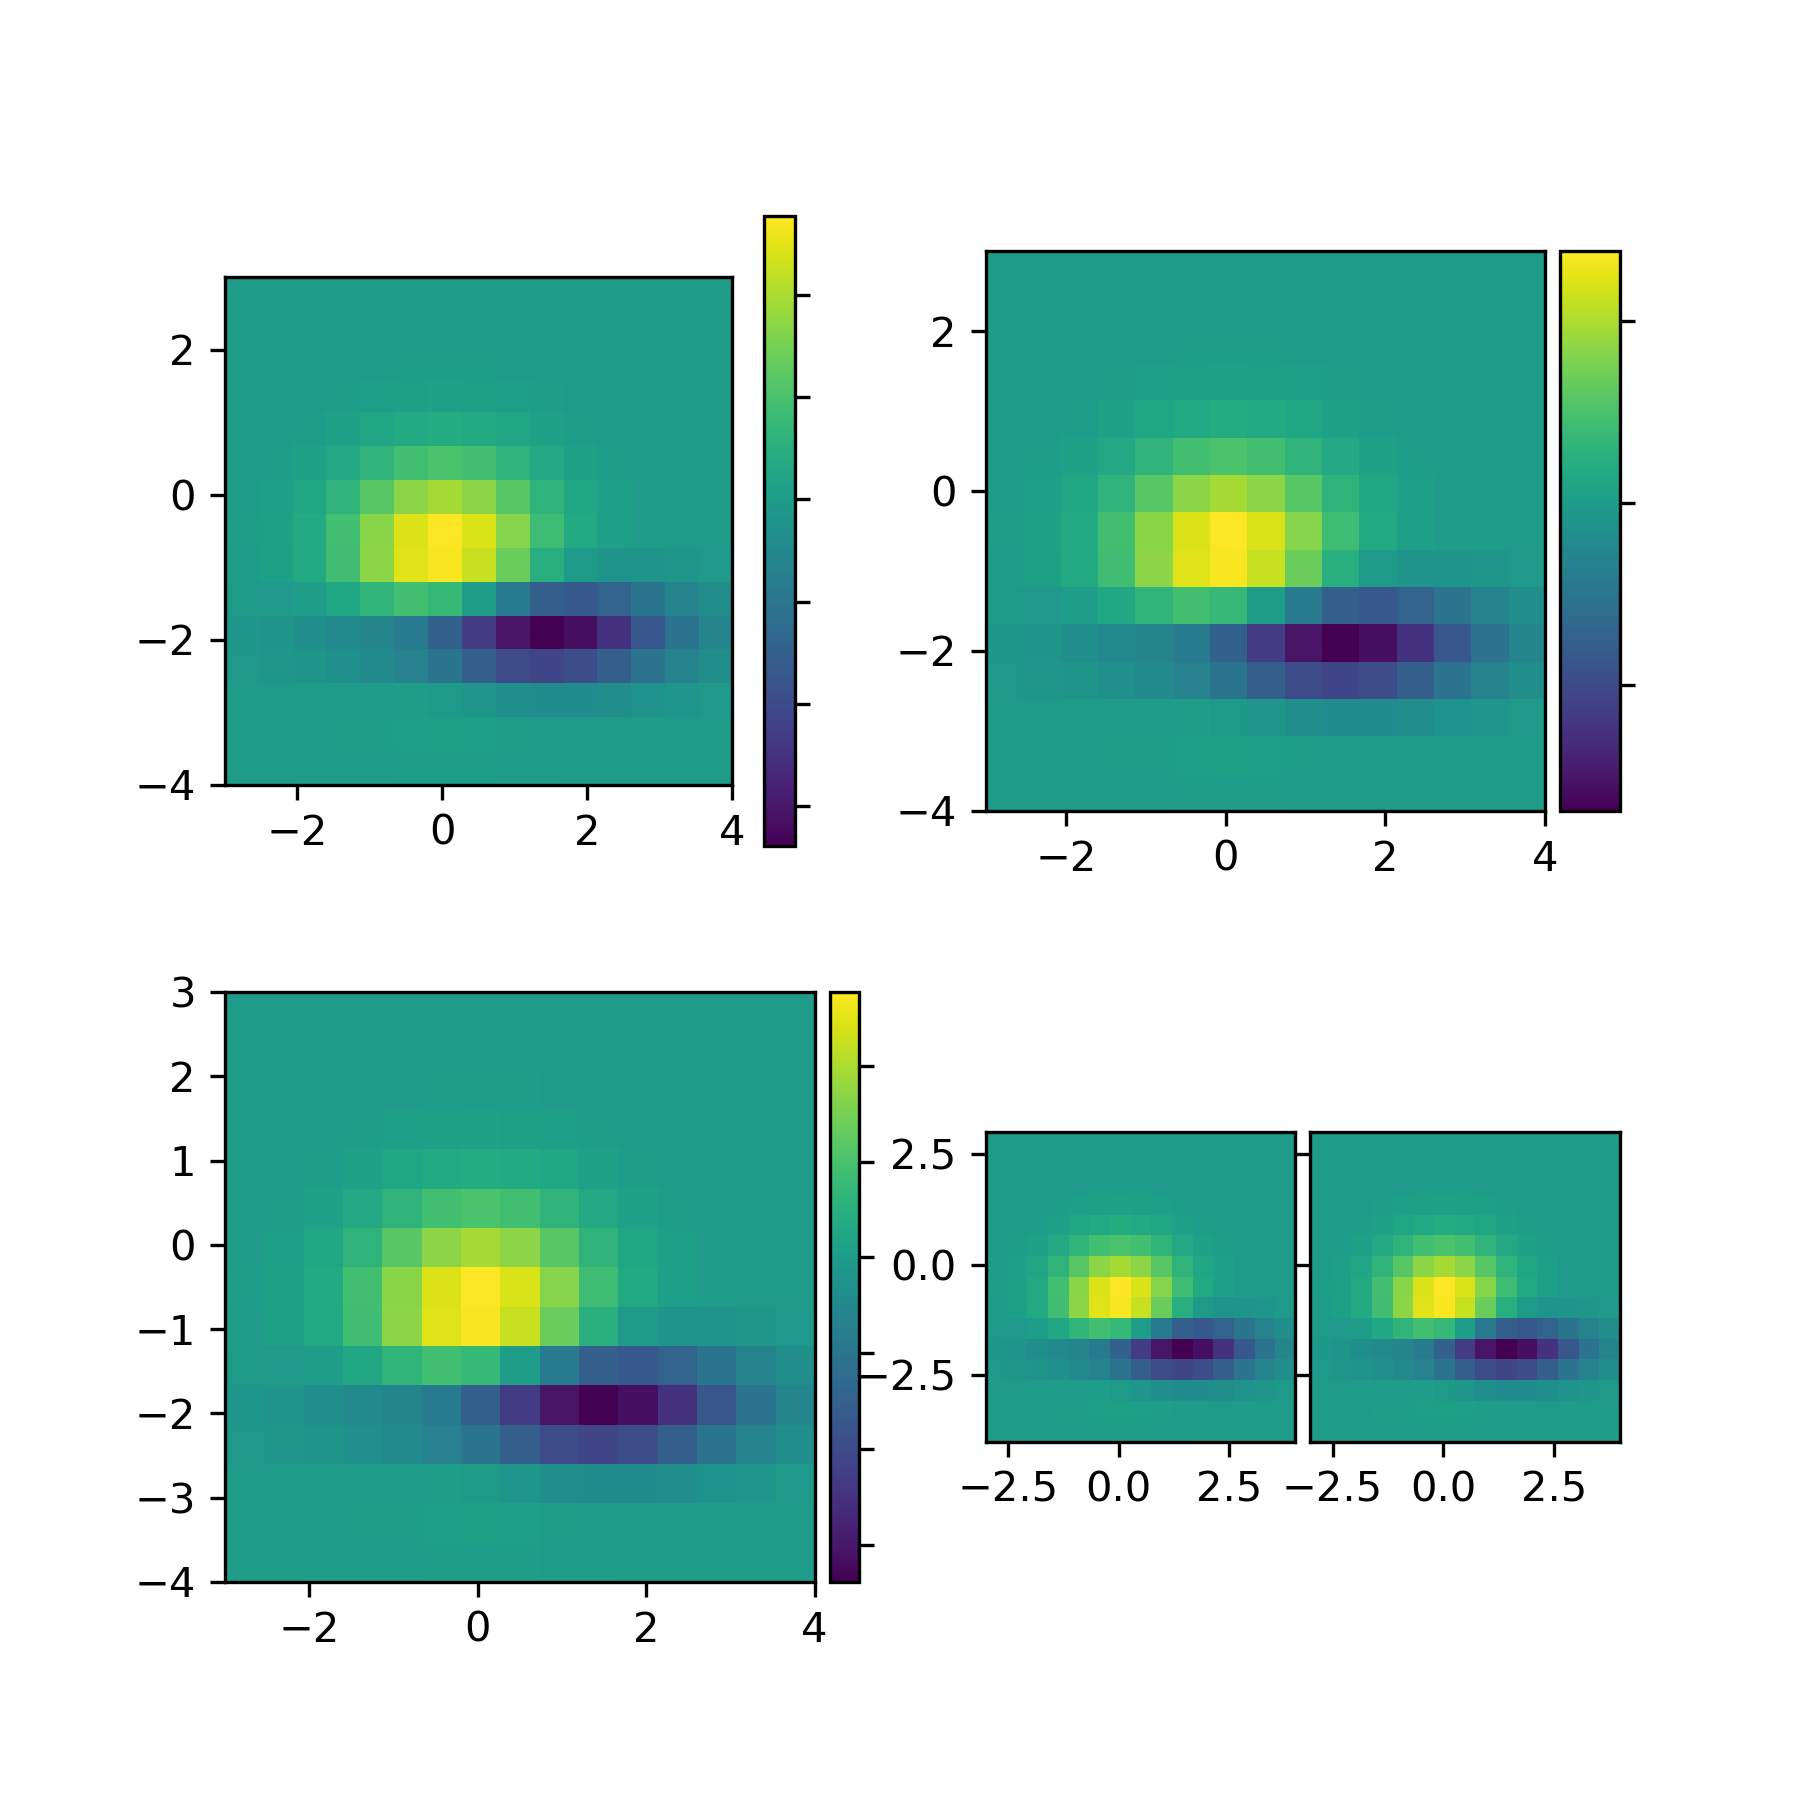
Axes Divider
============
Axes divider to calculate location of axes and
create a divider for them using existing axes instances.
"""
...
... from matplotlib import cbook
... import matplotlib.pyplot as plt
...
...
... def get_demo_image():
... z = cbook.get_sample_data("axes_grid/bivariate_normal.npy", np_load=True)
... # z is a numpy array of 15x15
... return z, (-3, 4, -4, 3)
...
...
... def demo_simple_image(ax):
... Z, extent = get_demo_image()
...
... im = ax.imshow(Z, extent=extent)
... cb = plt.colorbar(im)
... cb.ax.yaxis.set_tick_params(labelright=False)
...
...
... def demo_locatable_axes_hard(fig):
...
... from mpl_toolkits.axes_grid1 import SubplotDivider, Size
... from mpl_toolkits.axes_grid1.mpl_axes import Axes
...
... divider = SubplotDivider(fig, 2, 2, 2, aspect=True)
...
... # axes for image
... ax = fig.add_axes(divider.get_position(), axes_class=Axes)
...
... # axes for colorbar
... # (the label prevents Axes.add_axes from incorrectly believing that the two
... # axes are the same)
... ax_cb = fig.add_axes(divider.get_position(), axes_class=Axes, label="cb")
...
... h = [Size.AxesX(ax), # main axes
... Size.Fixed(0.05), # padding, 0.1 inch
... Size.Fixed(0.2), # colorbar, 0.3 inch
... ]
...
... v = [Size.AxesY(ax)]
...
... divider.set_horizontal(h)
... divider.set_vertical(v)
...
... ax.set_axes_locator(divider.new_locator(nx=0, ny=0))
... ax_cb.set_axes_locator(divider.new_locator(nx=2, ny=0))
...
... ax_cb.axis["left"].toggle(all=False)
... ax_cb.axis["right"].toggle(ticks=True)
...
... Z, extent = get_demo_image()
...
... im = ax.imshow(Z, extent=extent)
... plt.colorbar(im, cax=ax_cb)
... ax_cb.yaxis.set_tick_params(labelright=False)
...
...
... def demo_locatable_axes_easy(ax):
... from mpl_toolkits.axes_grid1 import make_axes_locatable
...
... divider = make_axes_locatable(ax)
...
... ax_cb = divider.new_horizontal(size="5%", pad=0.05)
... fig = ax.get_figure()
... fig.add_axes(ax_cb)
...
... Z, extent = get_demo_image()
... im = ax.imshow(Z, extent=extent)
...
... plt.colorbar(im, cax=ax_cb)
... ax_cb.yaxis.tick_right()
... ax_cb.yaxis.set_tick_params(labelright=False)
...
...
... def demo_images_side_by_side(ax):
... from mpl_toolkits.axes_grid1 import make_axes_locatable
...
... divider = make_axes_locatable(ax)
...
... Z, extent = get_demo_image()
... ax2 = divider.new_horizontal(size="100%", pad=0.05)
... fig1 = ax.get_figure()
... fig1.add_axes(ax2)
...
... ax.imshow(Z, extent=extent)
... ax2.imshow(Z, extent=extent)
... ax2.yaxis.set_tick_params(labelleft=False)
...
...
... def demo():
...
... fig = plt.figure(figsize=(6, 6))
...
... # PLOT 1
... # simple image & colorbar
... ax = fig.add_subplot(2, 2, 1)
... demo_simple_image(ax)
...
... # PLOT 2
... # image and colorbar whose location is adjusted in the drawing time.
... # a hard way
...
... demo_locatable_axes_hard(fig)
...
... # PLOT 3
... # image and colorbar whose location is adjusted in the drawing time.
... # a easy way
...
... ax = fig.add_subplot(2, 2, 3)
... demo_locatable_axes_easy(ax)
...
... # PLOT 4
... # two images side by side with fixed padding.
...
... ax = fig.add_subplot(2, 2, 4)
... demo_images_side_by_side(ax)
...
... plt.show()
...
...
... demo()
...