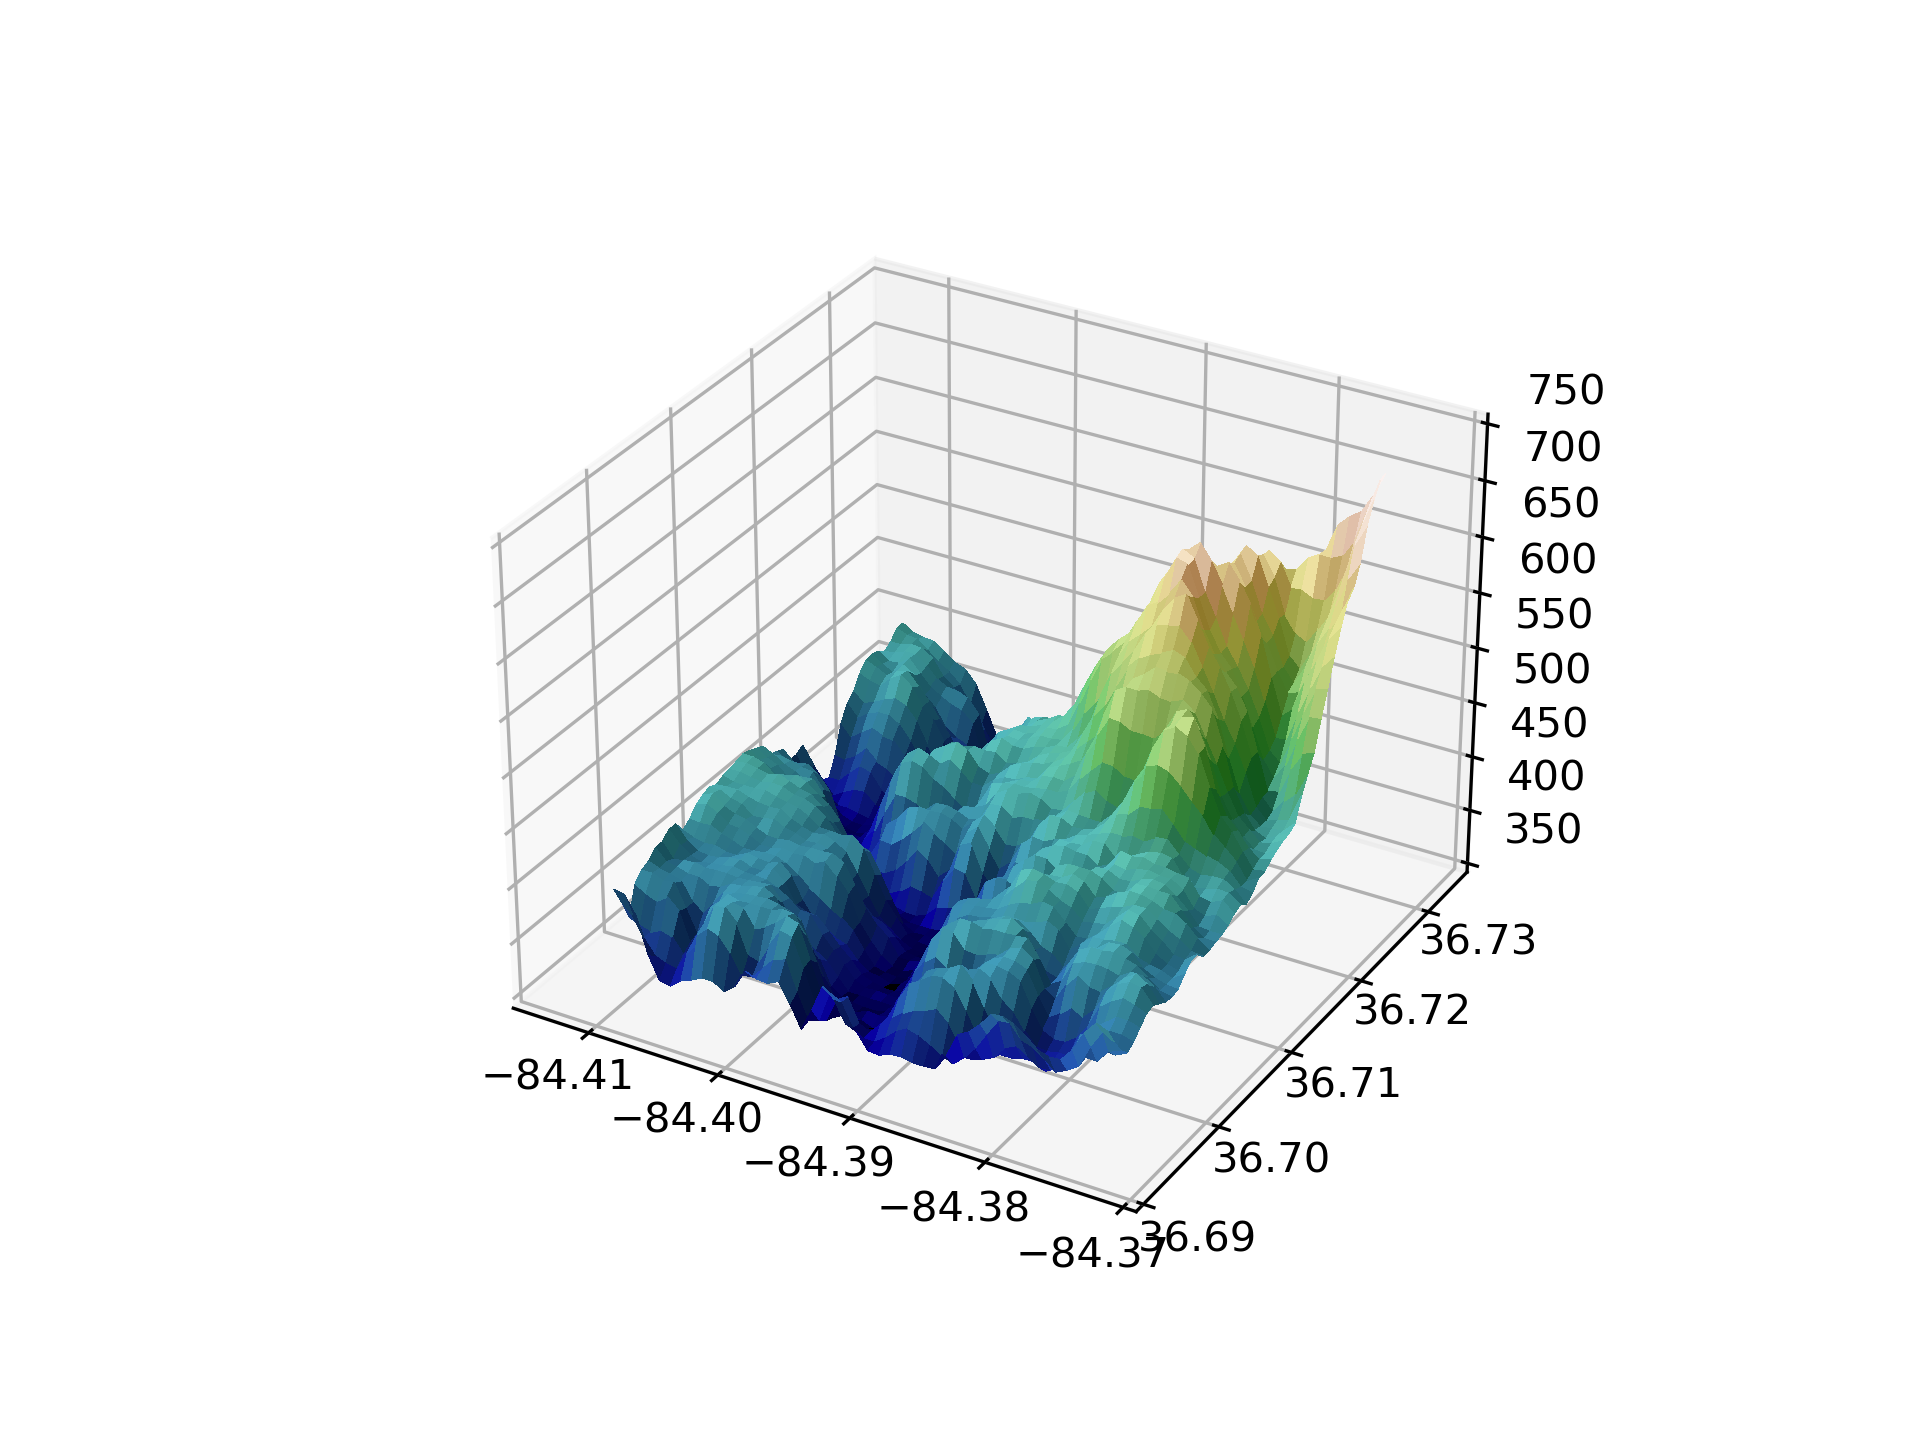
>>> """
=======================================
Custom hillshading in a 3D surface plot
=======================================

Demonstrates using custom hillshading in a 3D surface plot.
"""
...
... from matplotlib import cbook
... from matplotlib import cm
... from matplotlib.colors import LightSource
... import matplotlib.pyplot as plt
... import numpy as np
...
... # Load and format data
... dem = cbook.get_sample_data('jacksboro_fault_dem.npz', np_load=True)
... z = dem['elevation']
... nrows, ncols = z.shape
... x = np.linspace(dem['xmin'], dem['xmax'], ncols)
... y = np.linspace(dem['ymin'], dem['ymax'], nrows)
... x, y = np.meshgrid(x, y)
...
... region = np.s_[5:50, 5:50]
... x, y, z = x[region], y[region], z[region]
...
... # Set up plot
... fig, ax = plt.subplots(subplot_kw=dict(projection='3d'))
...
... ls = LightSource(270, 45)
... # To use a custom hillshading mode, override the built-in shading and pass
... # in the rgb colors of the shaded surface calculated from "shade".
... rgb = ls.shade(z, cmap=cm.gist_earth, vert_exag=0.1, blend_mode='soft')
... surf = ax.plot_surface(x, y, z, rstride=1, cstride=1, facecolors=rgb,
...                        linewidth=0, antialiased=False, shade=False)
...
... plt.show()
...