>>> """
========================
Composing Custom Legends
========================
Composing custom legends piece-by-piece.
.. note::
For more information on creating and customizing legends, see the following
pages:
* :doc:`/tutorials/intermediate/legend_guide`
* :doc:`/gallery/text_labels_and_annotations/legend_demo`
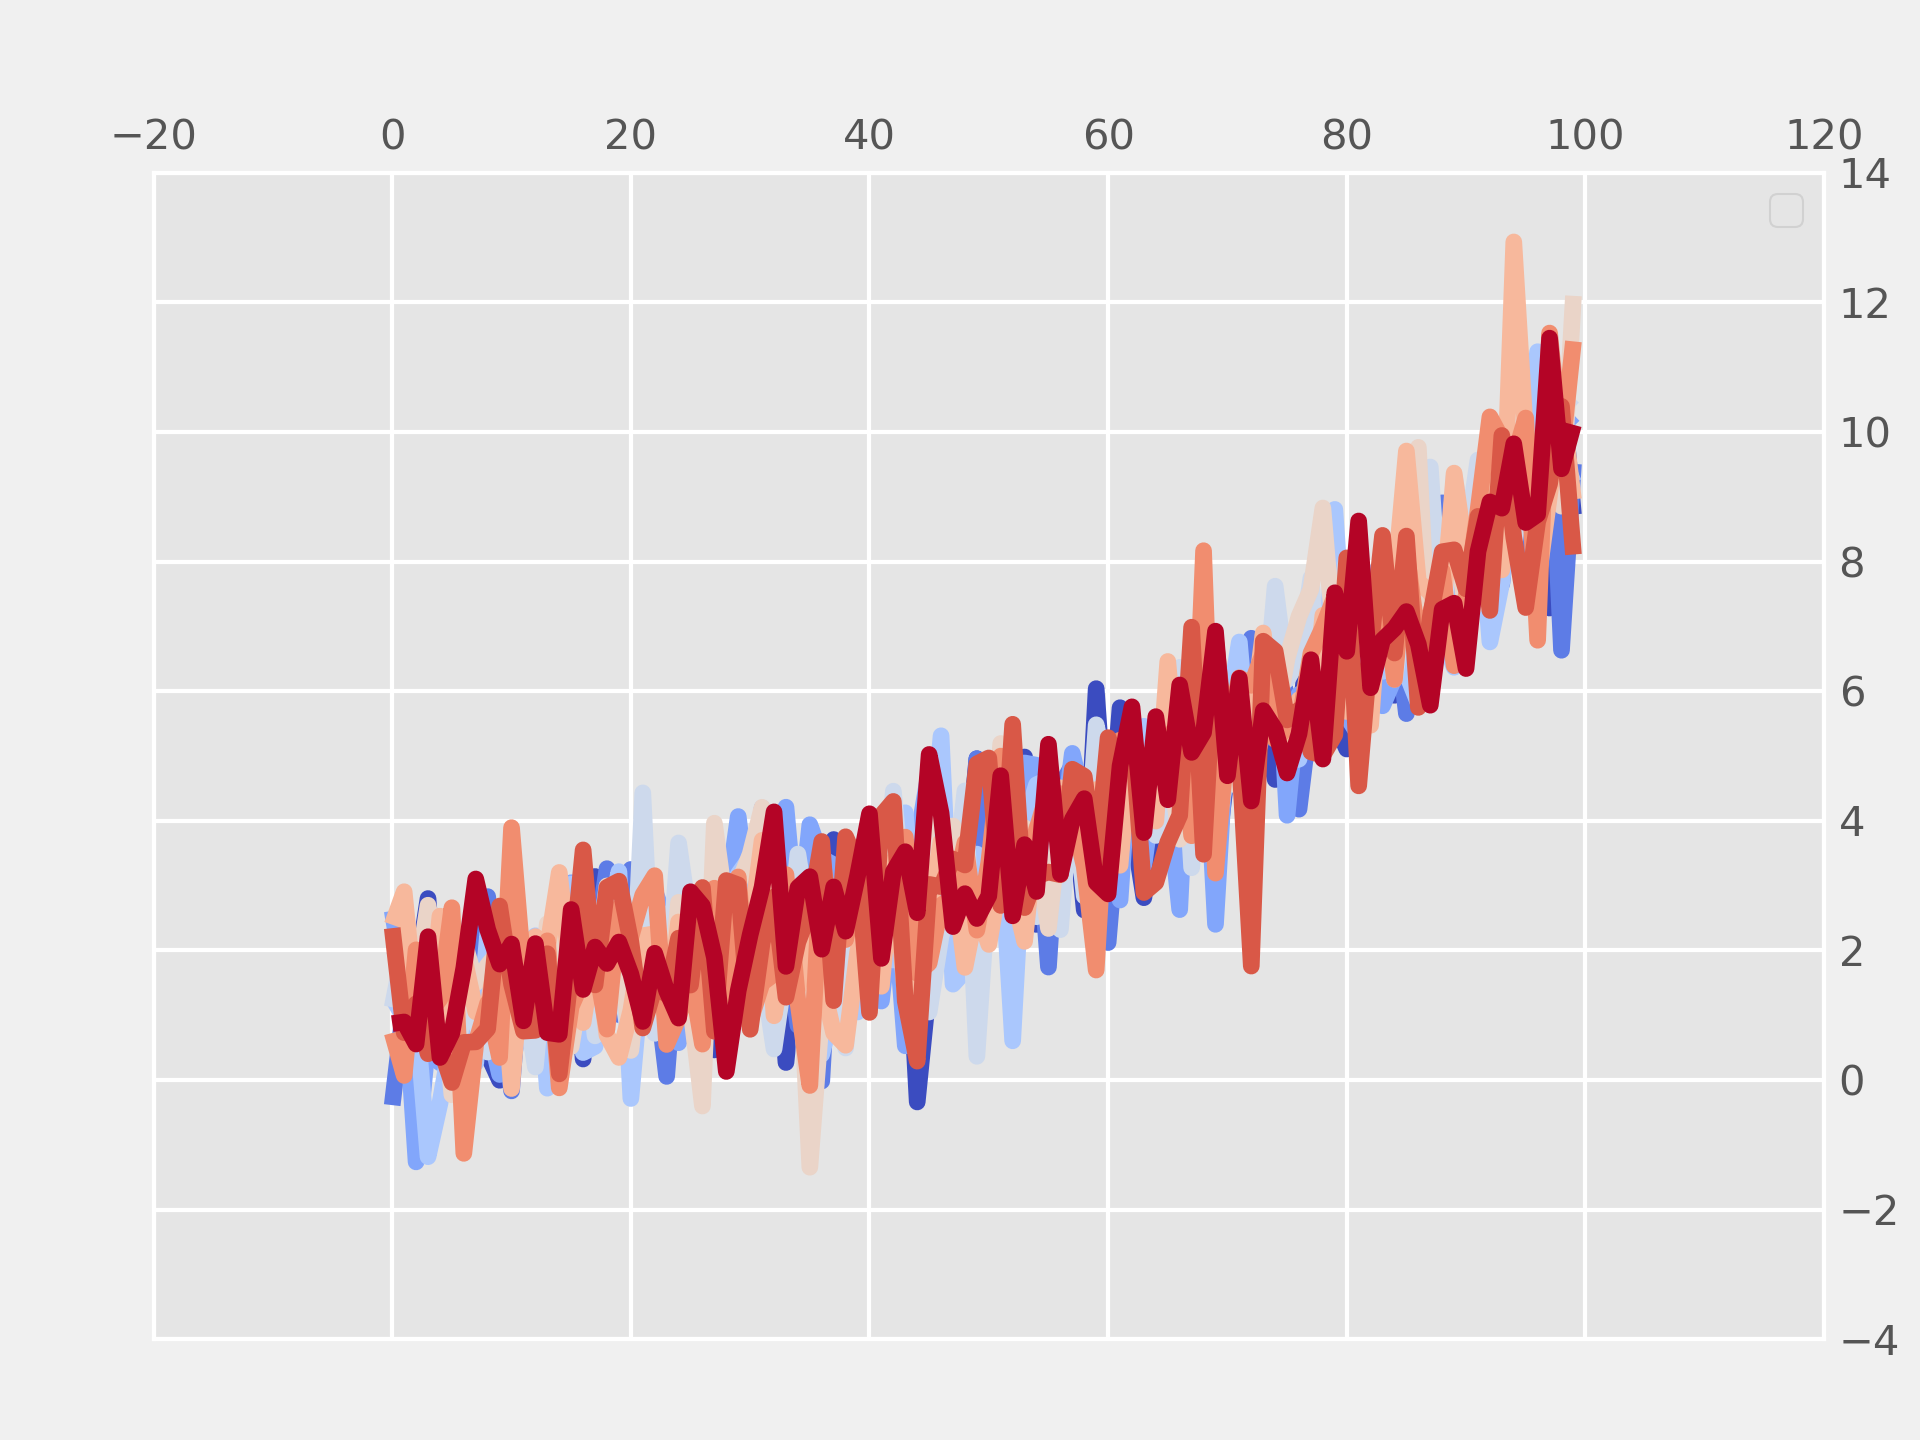
Sometimes you don't want a legend that is explicitly tied to data that
you have plotted. For example, say you have plotted 10 lines, but don't
want a legend item to show up for each one. If you simply plot the lines
and call ``ax.legend()``, you will get the following:
"""
... # sphinx_gallery_thumbnail_number = 2
... from matplotlib import rcParams, cycler
... import matplotlib.pyplot as plt
... import numpy as np
...
... # Fixing random state for reproducibility
... np.random.seed(19680801)
...
... N = 10
... data = (np.geomspace(1, 10, 100) + np.random.randn(N, 100)).T
... cmap = plt.cm.coolwarm
... rcParams['axes.prop_cycle'] = cycler(color=cmap(np.linspace(0, 1, N)))
...
... fig, ax = plt.subplots()
... lines = ax.plot(data)
... ax.legend()
...
... ##############################################################################
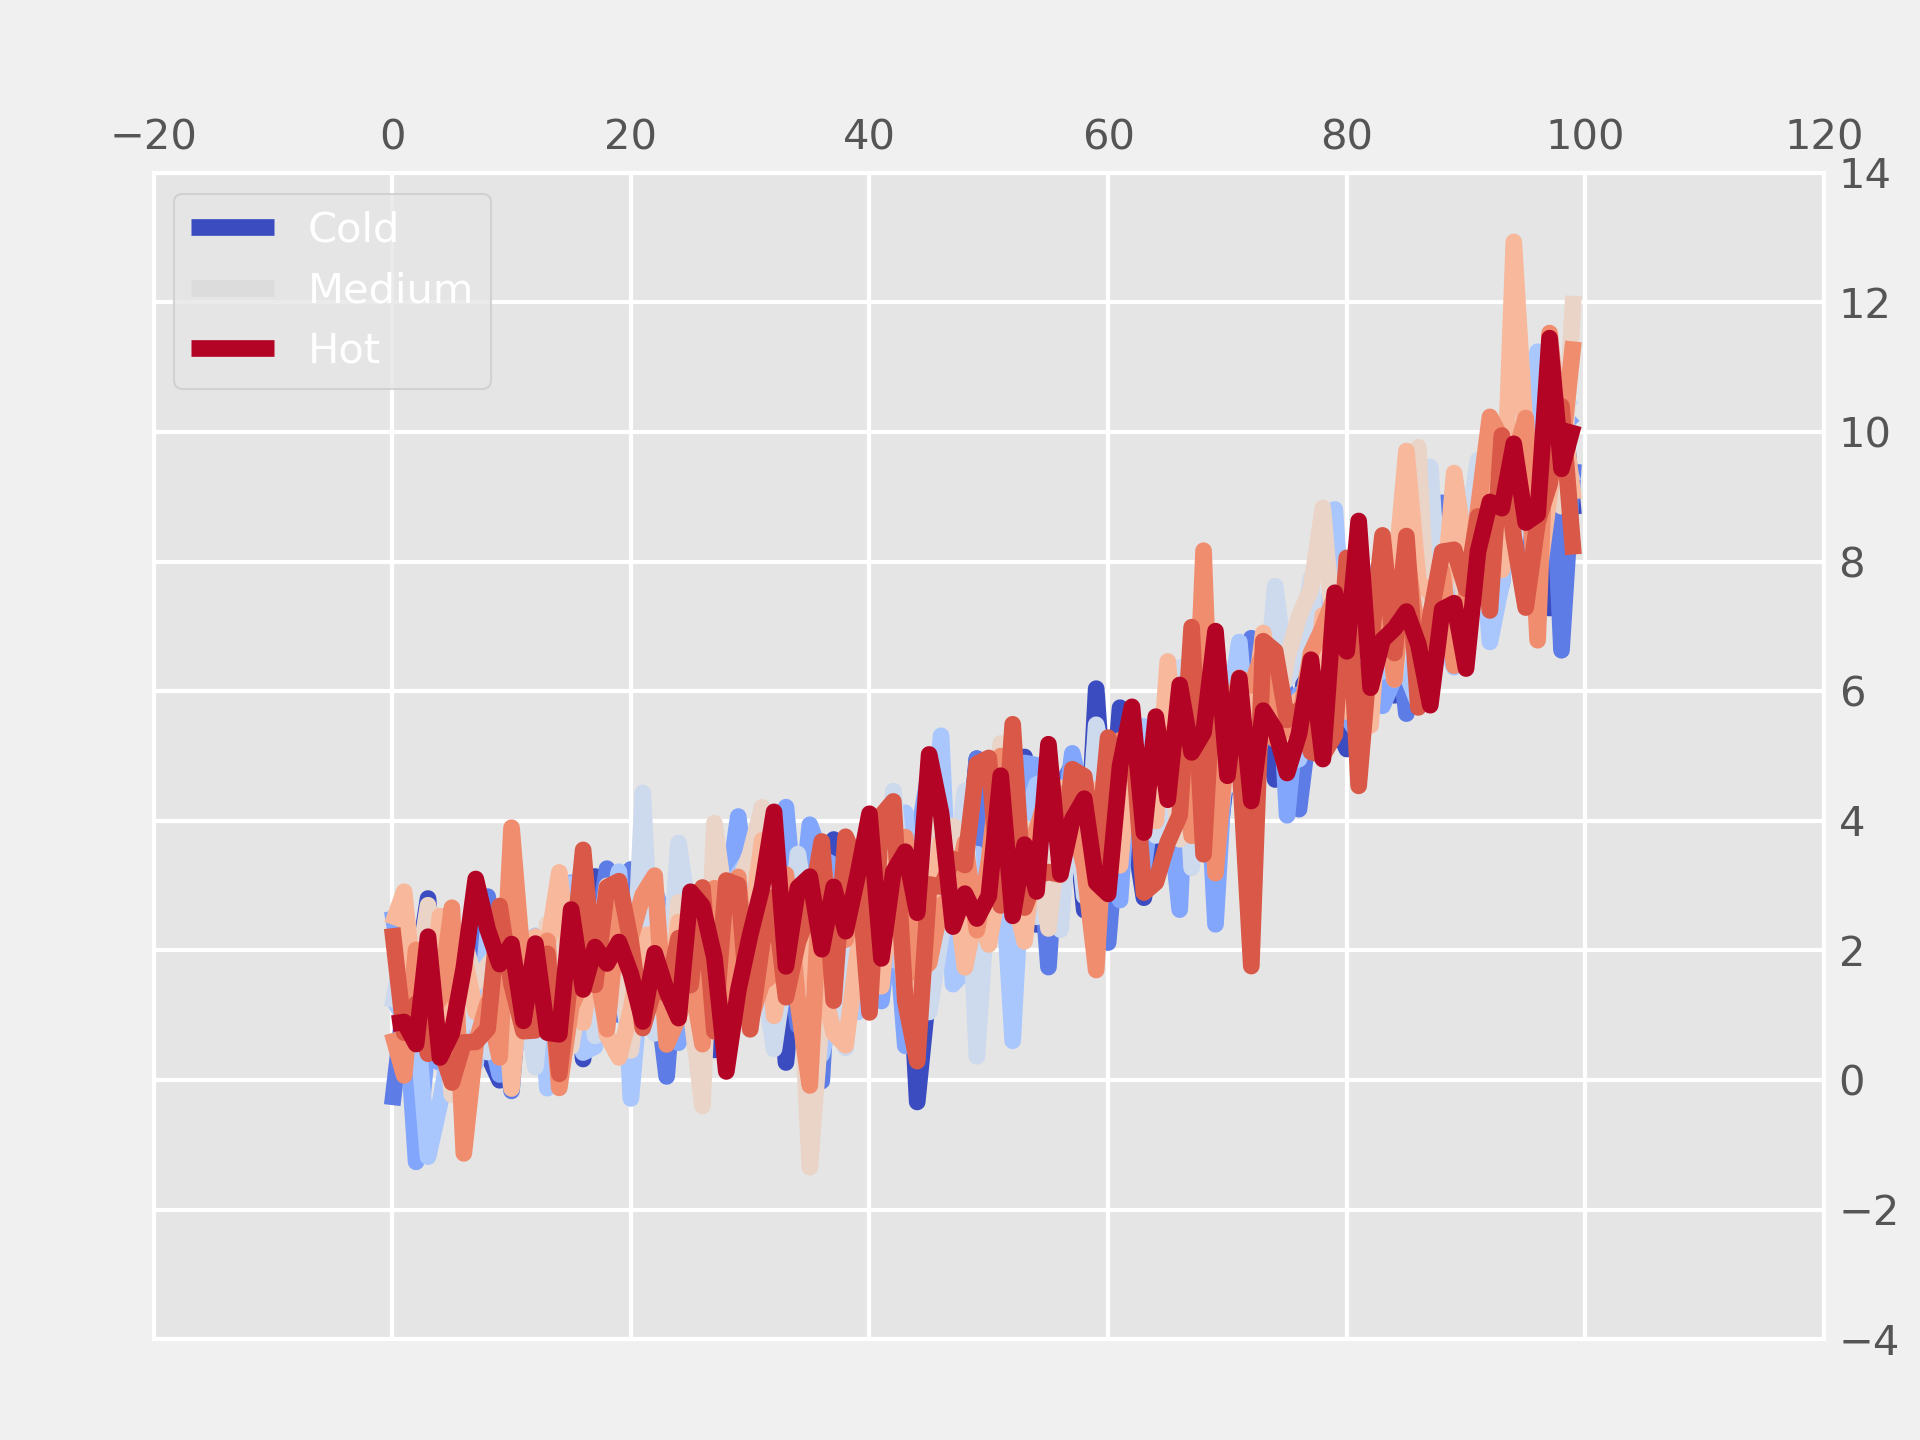
... # Note that no legend entries were created.
... # In this case, we can compose a legend using Matplotlib objects that aren't
... # explicitly tied to the data that was plotted. For example:
...
... from matplotlib.lines import Line2D
... custom_lines = [Line2D([0], [0], color=cmap(0.), lw=4),
... Line2D([0], [0], color=cmap(.5), lw=4),
... Line2D([0], [0], color=cmap(1.), lw=4)]
...
... fig, ax = plt.subplots()
... lines = ax.plot(data)
... ax.legend(custom_lines, ['Cold', 'Medium', 'Hot'])
...
...
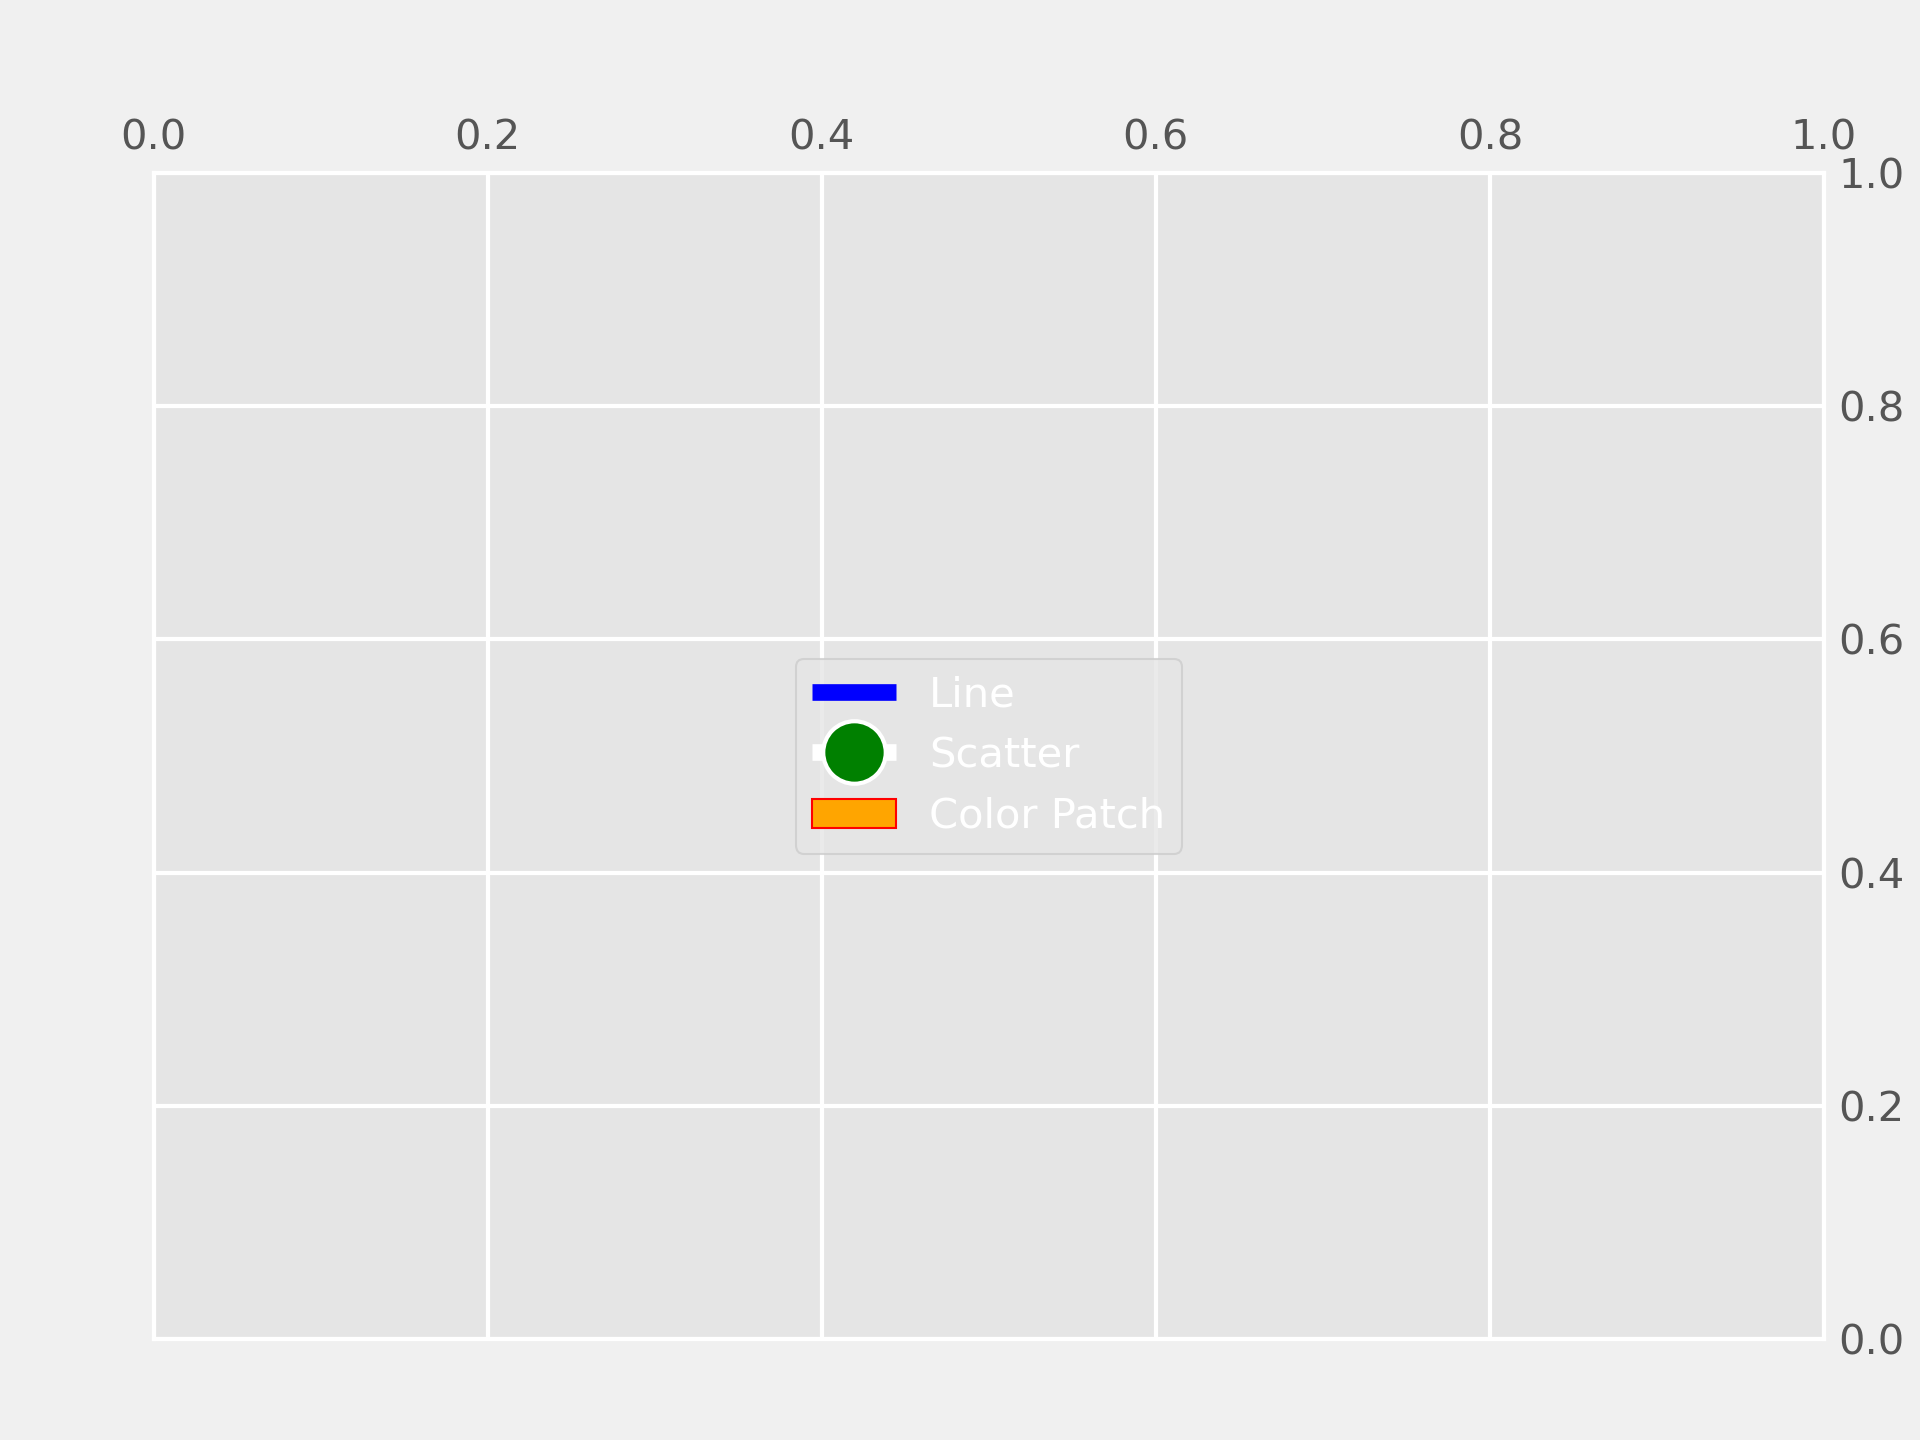
... ###############################################################################
... # There are many other Matplotlib objects that can be used in this way. In the
... # code below we've listed a few common ones.
...
... from matplotlib.patches import Patch
... from matplotlib.lines import Line2D
...
... legend_elements = [Line2D([0], [0], color='b', lw=4, label='Line'),
... Line2D([0], [0], marker='o', color='w', label='Scatter',
... markerfacecolor='g', markersize=15),
... Patch(facecolor='orange', edgecolor='r',
... label='Color Patch')]
...
... # Create the figure
... fig, ax = plt.subplots()
... ax.legend(handles=legend_elements, loc='center')
...
... plt.show()
...