>>> """
==================
Contour Label Demo
==================
Illustrate some of the more advanced things that one can do with
contour labels.
See also the :doc:`contour demo example
</gallery/images_contours_and_fields/contour_demo>`.
"""
...
... import numpy as np
... import matplotlib.ticker as ticker
... import matplotlib.pyplot as plt
...
... ###############################################################################
... # Define our surface
...
... delta = 0.025
... x = np.arange(-3.0, 3.0, delta)
... y = np.arange(-2.0, 2.0, delta)
... X, Y = np.meshgrid(x, y)
... Z1 = np.exp(-X**2 - Y**2)
... Z2 = np.exp(-(X - 1)**2 - (Y - 1)**2)
... Z = (Z1 - Z2) * 2
...
... ###############################################################################
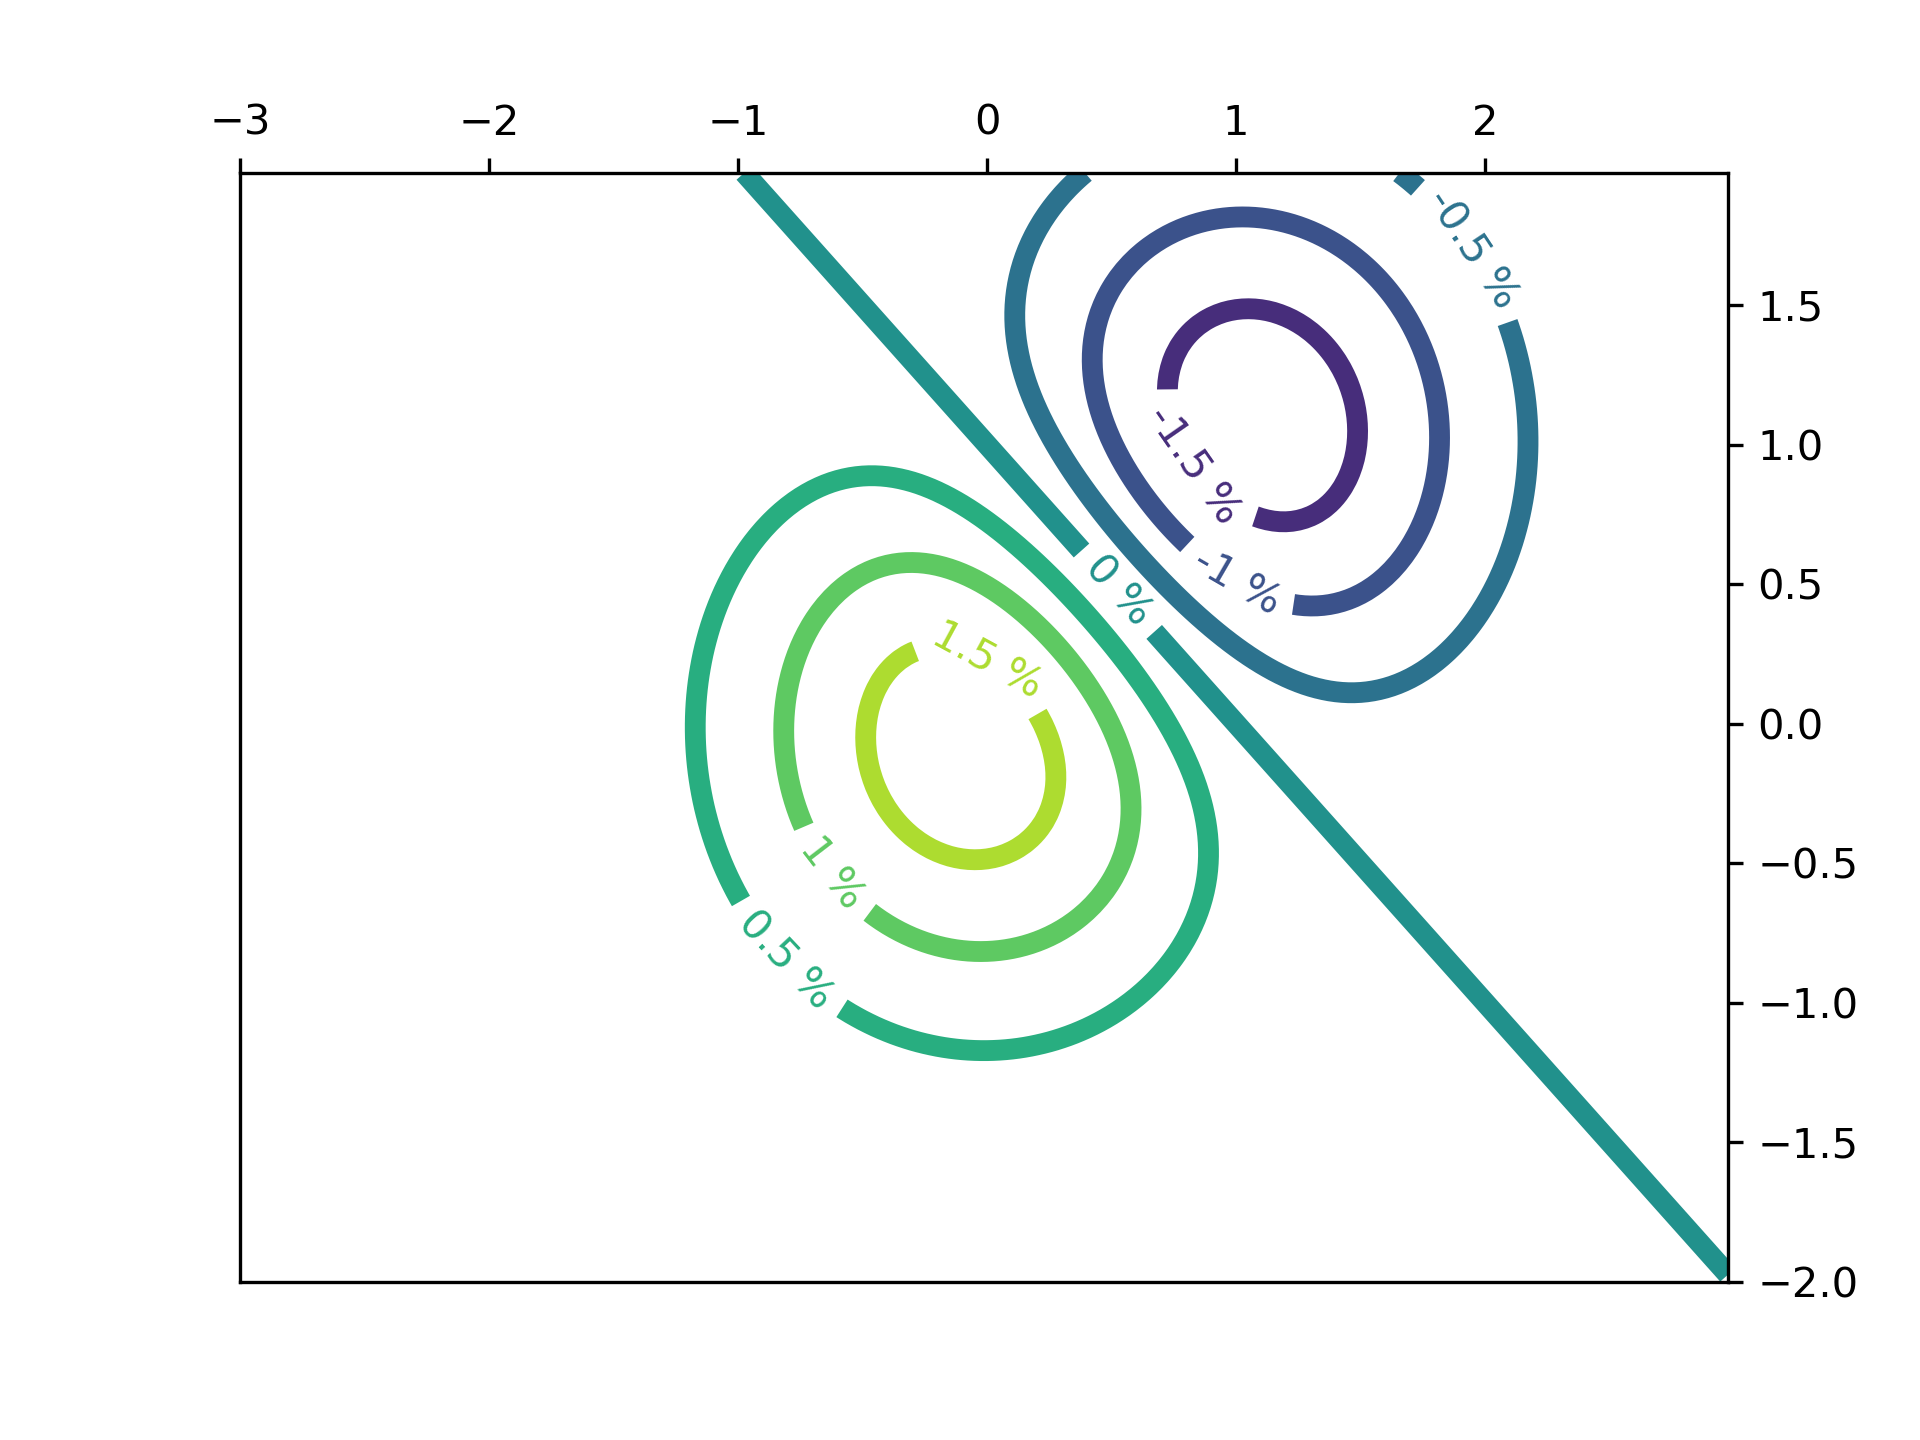
... # Make contour labels with custom level formatters
...
...
... # This custom formatter removes trailing zeros, e.g. "1.0" becomes "1", and
... # then adds a percent sign.
... def fmt(x):
... s = f"{x:.1f}"
... if s.endswith("0"):
... s = f"{x:.0f}"
... return rf"{s} \%" if plt.rcParams["text.usetex"] else f"{s} %"
...
...
... # Basic contour plot
... fig, ax = plt.subplots()
... CS = ax.contour(X, Y, Z)
...
... ax.clabel(CS, CS.levels, inline=True, fmt=fmt, fontsize=10)
...
... ###############################################################################
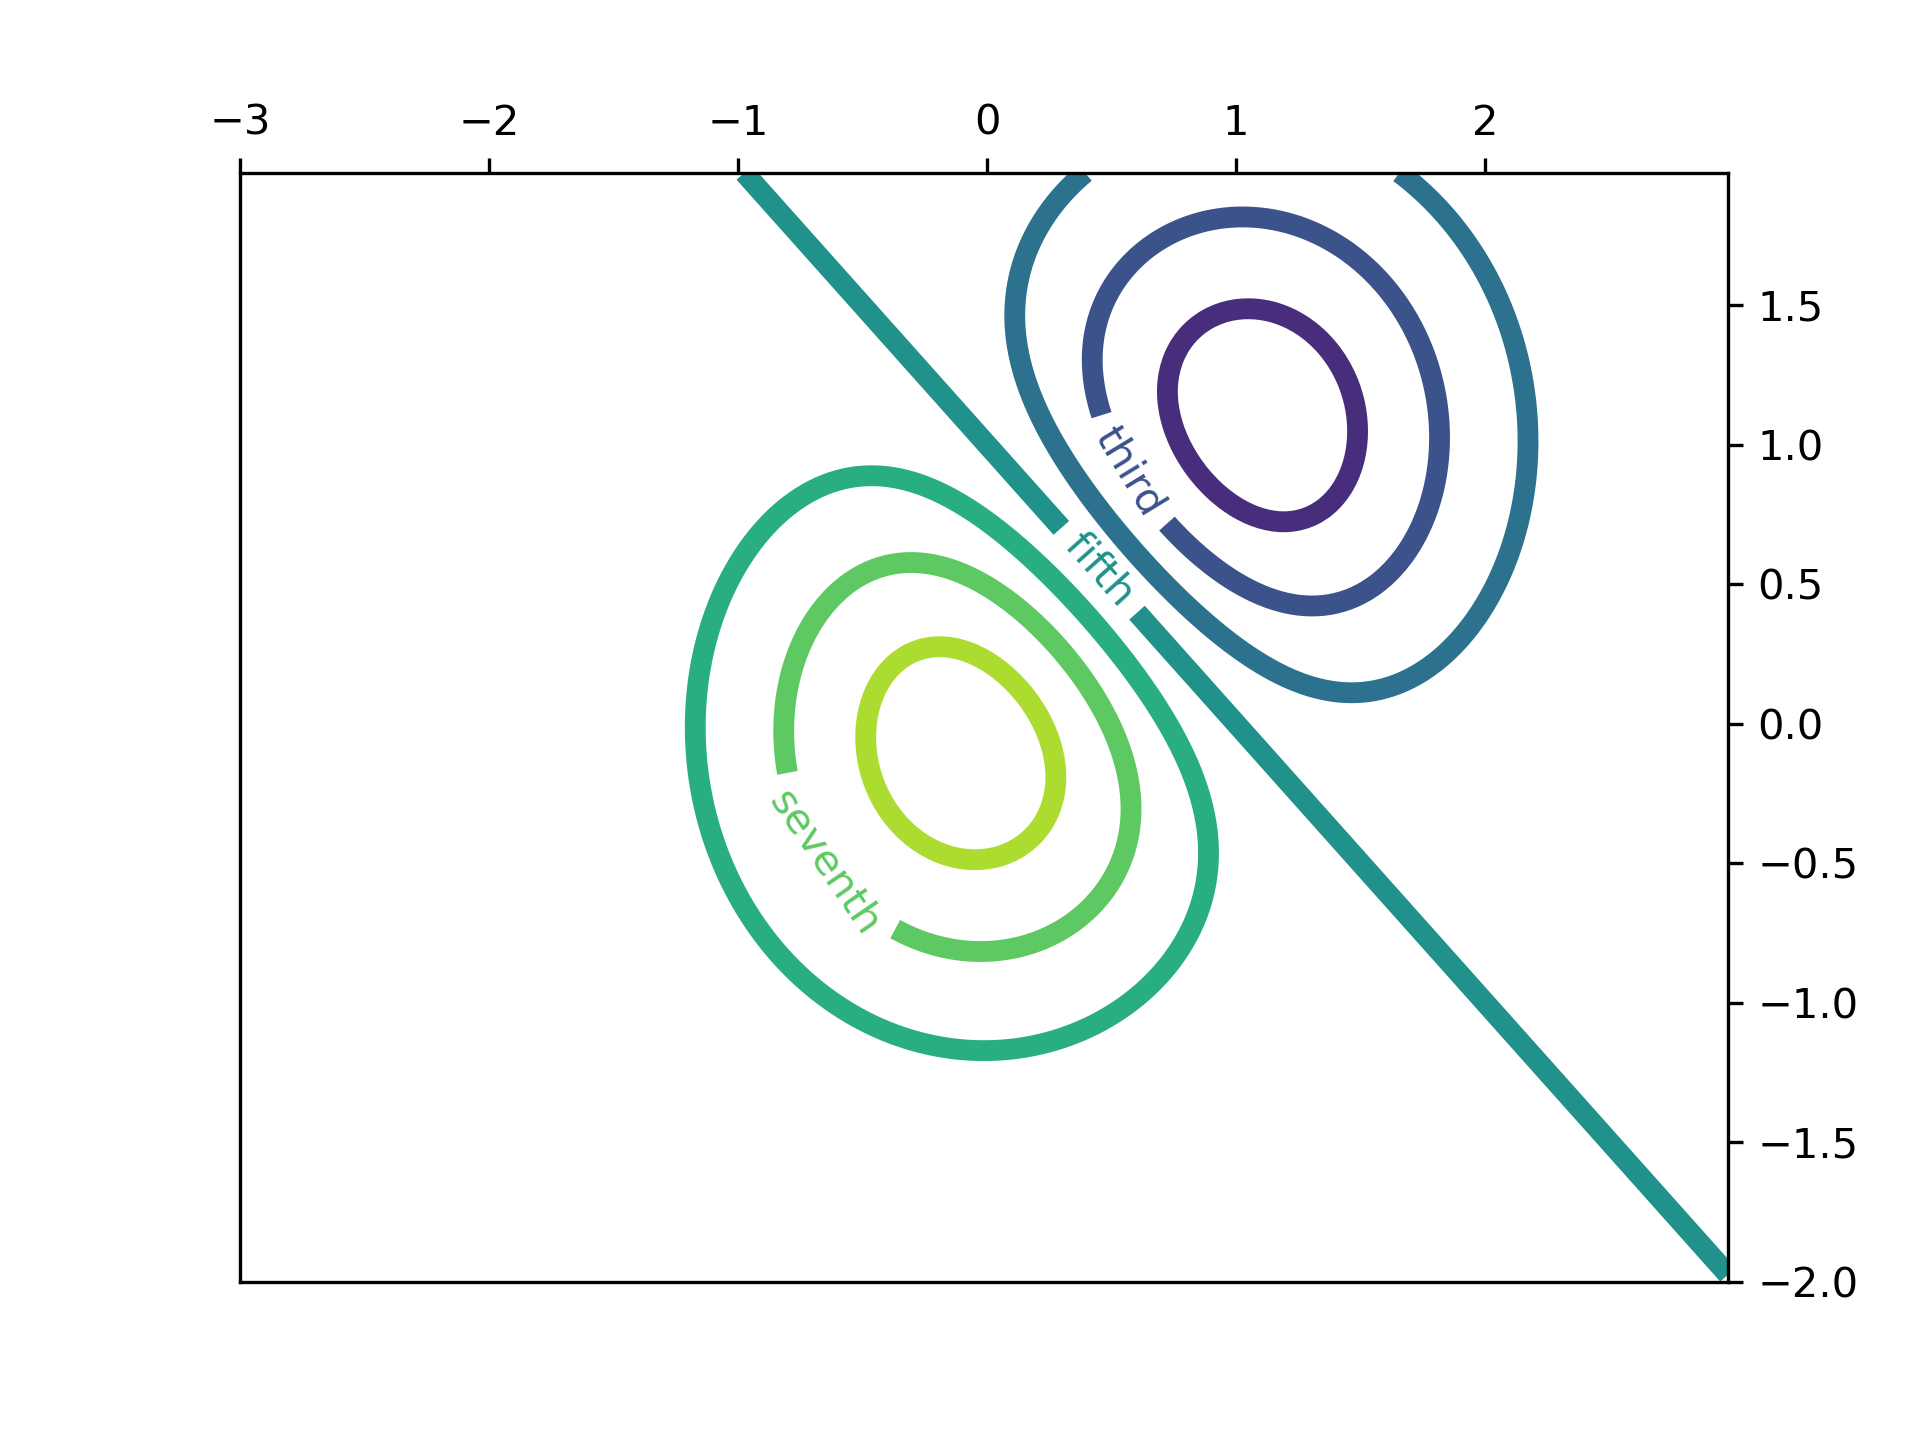
... # Label contours with arbitrary strings using a dictionary
...
... fig1, ax1 = plt.subplots()
...
... # Basic contour plot
... CS1 = ax1.contour(X, Y, Z)
...
... fmt = {}
... strs = ['first', 'second', 'third', 'fourth', 'fifth', 'sixth', 'seventh']
... for l, s in zip(CS1.levels, strs):
... fmt[l] = s
...
... # Label every other level using strings
... ax1.clabel(CS1, CS1.levels[::2], inline=True, fmt=fmt, fontsize=10)
...
... ###############################################################################
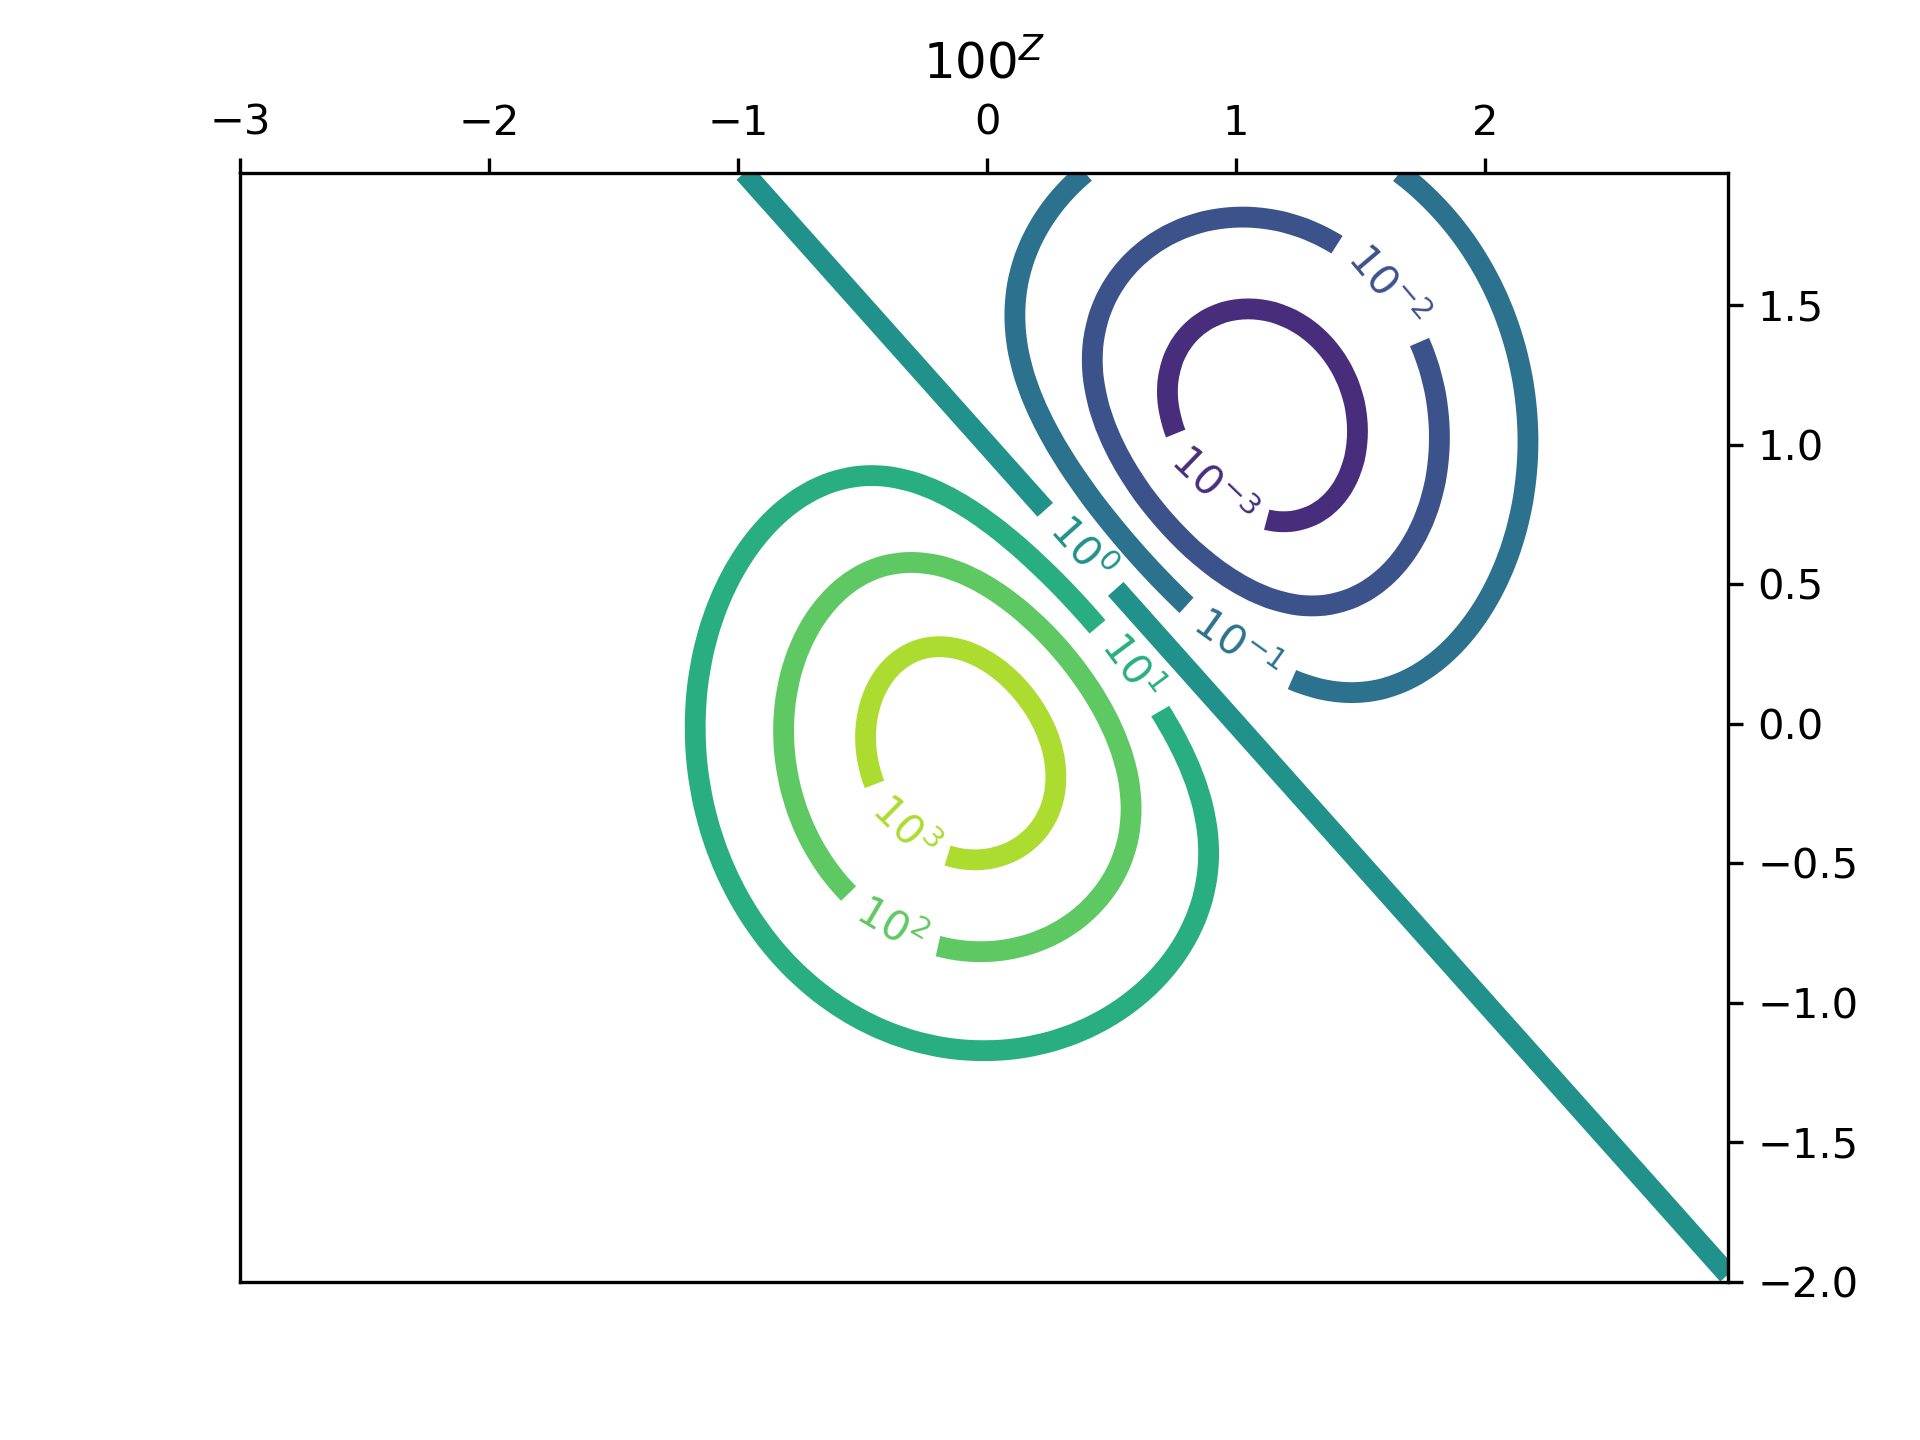
... # Use a Formatter
...
... fig2, ax2 = plt.subplots()
...
... CS2 = ax2.contour(X, Y, 100**Z, locator=plt.LogLocator())
... fmt = ticker.LogFormatterMathtext()
... fmt.create_dummy_axis()
... ax2.clabel(CS2, CS2.levels, fmt=fmt)
... ax2.set_title("$100^Z$")
...
... plt.show()
...
... #############################################################################
... #
... # .. admonition:: References
... #
... # The use of the following functions, methods, classes and modules is shown
... # in this example:
... #
... # - `matplotlib.axes.Axes.contour` / `matplotlib.pyplot.contour`
... # - `matplotlib.axes.Axes.clabel` / `matplotlib.pyplot.clabel`
... # - `matplotlib.ticker.LogFormatterMathtext`
... # - `matplotlib.ticker.TickHelper.create_dummy_axis`
...