>>> """
===================
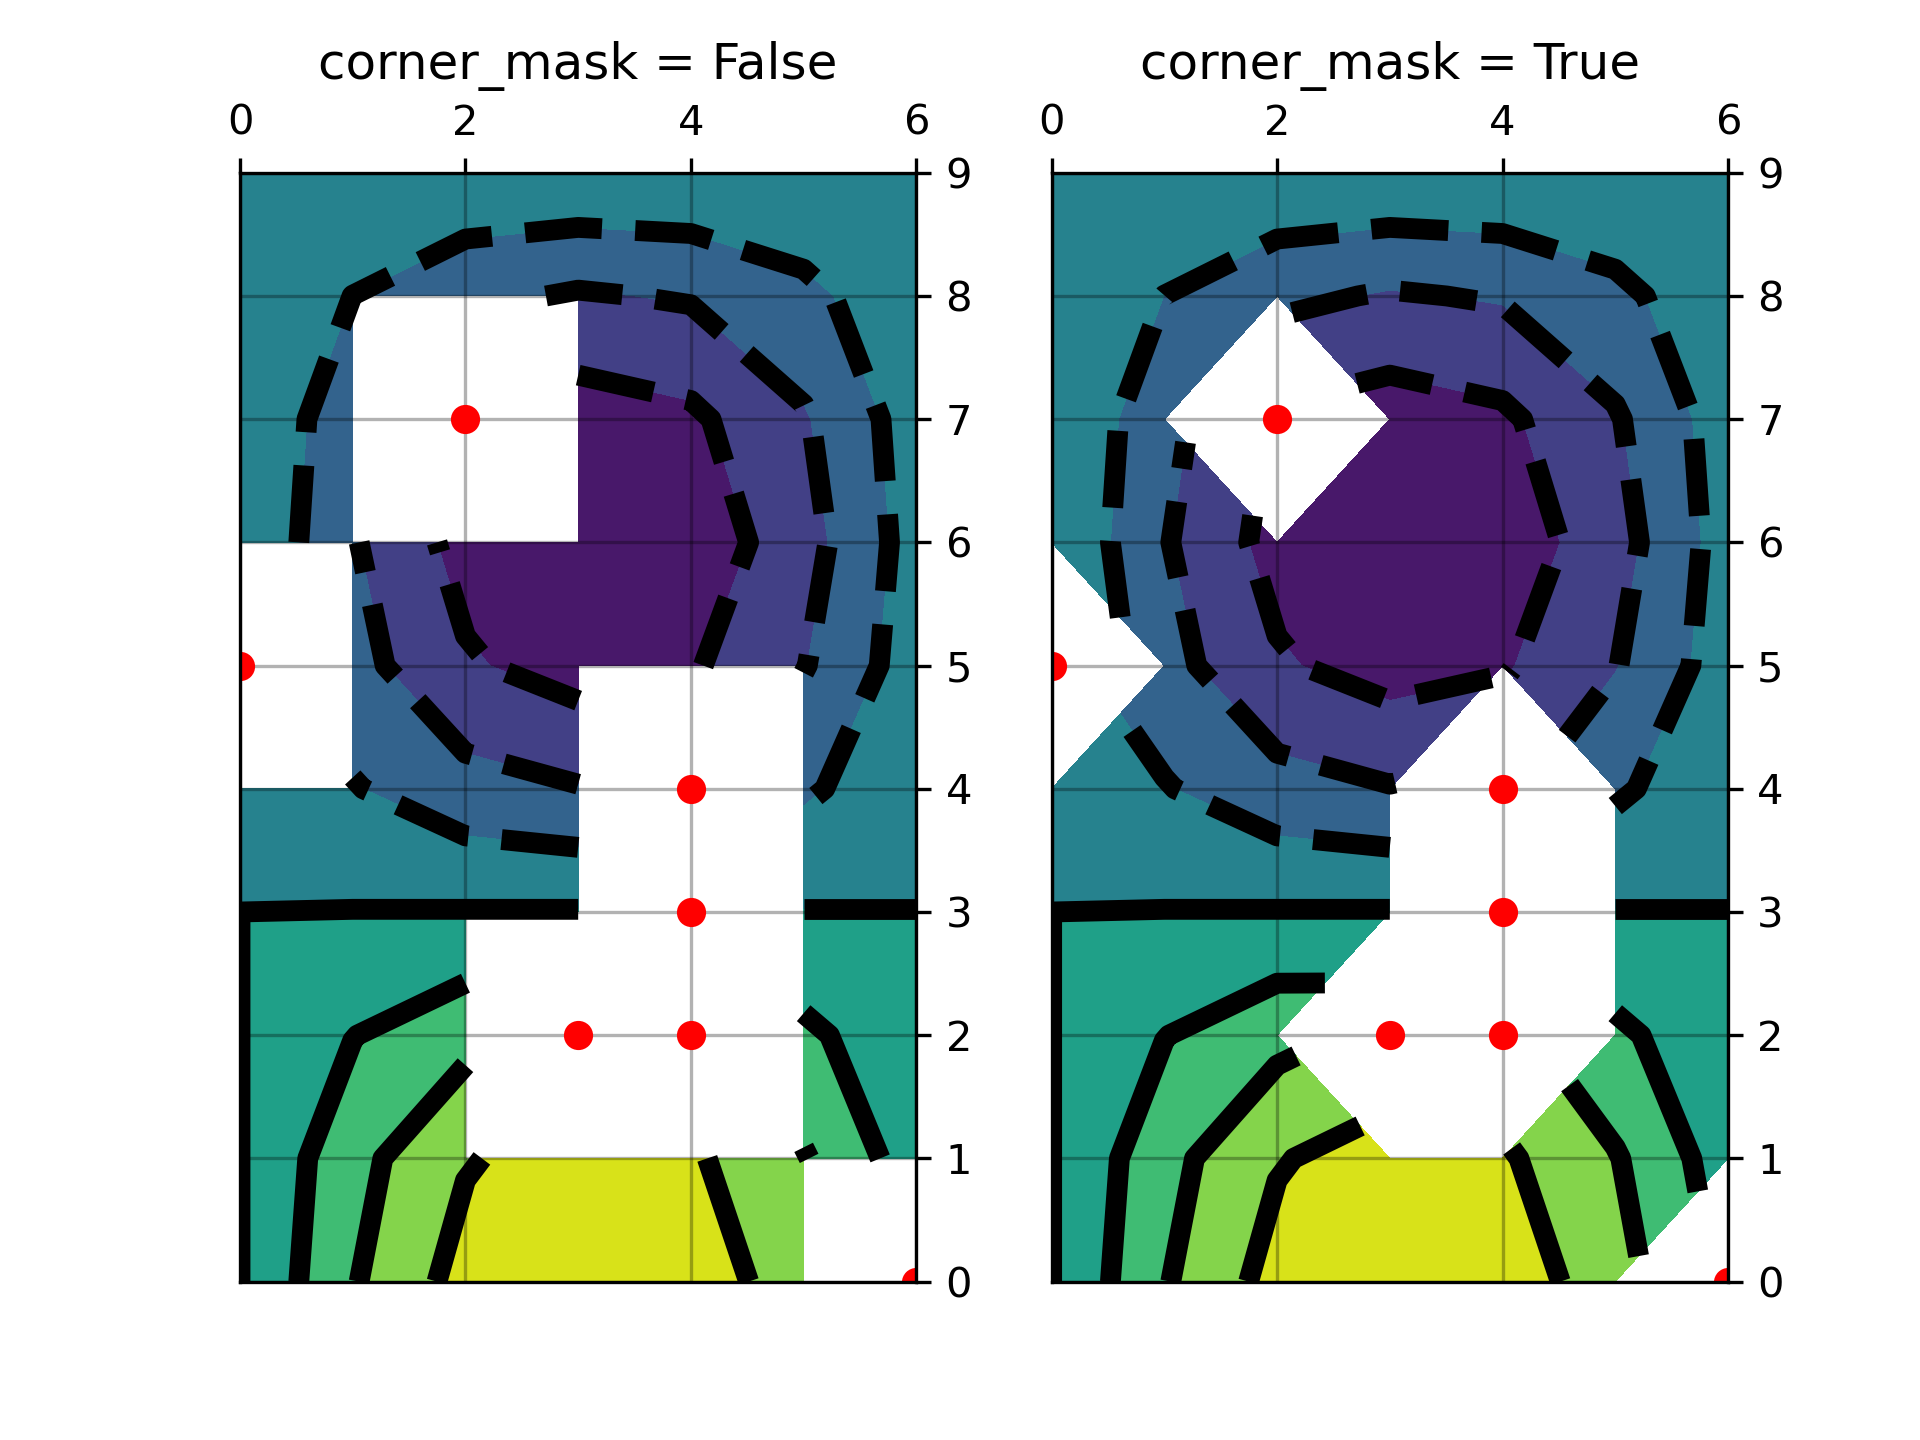
Contour Corner Mask
===================
Illustrate the difference between ``corner_mask=False`` and
``corner_mask=True`` for masked contour plots.
"""
... import matplotlib.pyplot as plt
... import numpy as np
...
... # Data to plot.
... x, y = np.meshgrid(np.arange(7), np.arange(10))
... z = np.sin(0.5 * x) * np.cos(0.52 * y)
...
... # Mask various z values.
... mask = np.zeros_like(z, dtype=bool)
... mask[2, 3:5] = True
... mask[3:5, 4] = True
... mask[7, 2] = True
... mask[5, 0] = True
... mask[0, 6] = True
... z = np.ma.array(z, mask=mask)
...
... corner_masks = [False, True]
... fig, axs = plt.subplots(ncols=2)
... for ax, corner_mask in zip(axs, corner_masks):
... cs = ax.contourf(x, y, z, corner_mask=corner_mask)
... ax.contour(cs, colors='k')
... ax.set_title('corner_mask = {0}'.format(corner_mask))
...
... # Plot grid.
... ax.grid(c='k', ls='-', alpha=0.3)
...
... # Indicate masked points with red circles.
... ax.plot(np.ma.array(x, mask=~mask), y, 'ro')
...
... plt.show()
...
... #############################################################################
... #
... # .. admonition:: References
... #
... # The use of the following functions, methods, classes and modules is shown
... # in this example:
... #
... # - `matplotlib.axes.Axes.contour` / `matplotlib.pyplot.contour`
... # - `matplotlib.axes.Axes.contourf` / `matplotlib.pyplot.contourf`
...