>>> """
==================================================
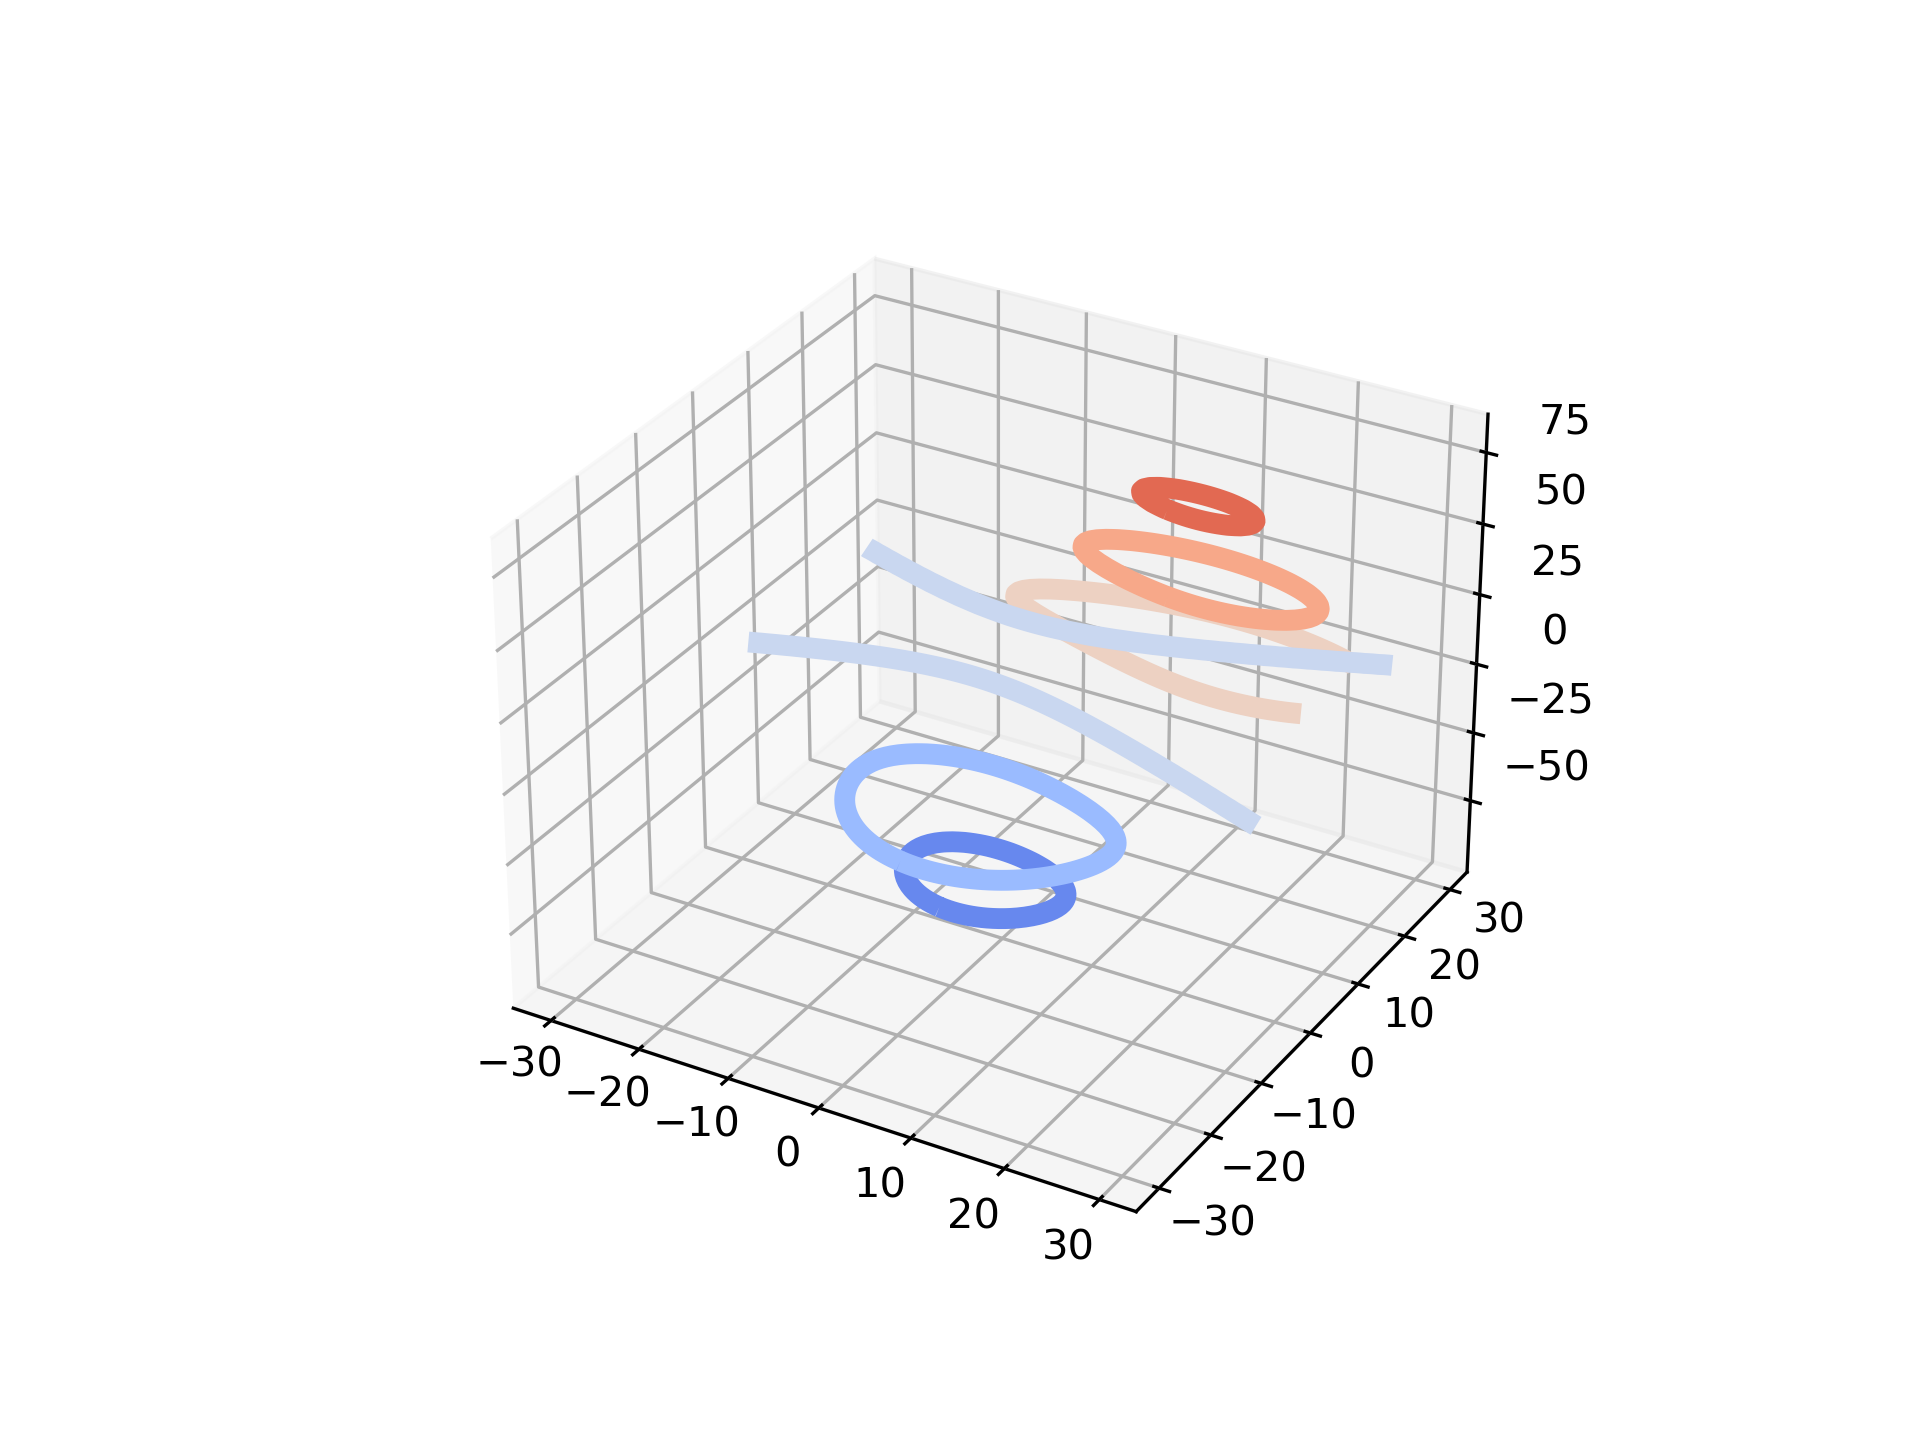
Demonstrates plotting contour (level) curves in 3D
==================================================
This is like a contour plot in 2D except that the ``f(x, y)=c`` curve is
plotted on the plane ``z=c``.
"""
...
... from mpl_toolkits.mplot3d import axes3d
... import matplotlib.pyplot as plt
... from matplotlib import cm
...
... ax = plt.figure().add_subplot(projection='3d')
... X, Y, Z = axes3d.get_test_data(0.05)
...
... ax.contour(X, Y, Z, cmap=cm.coolwarm) # Plot contour curves
...
... plt.show()
...