>>> """
================
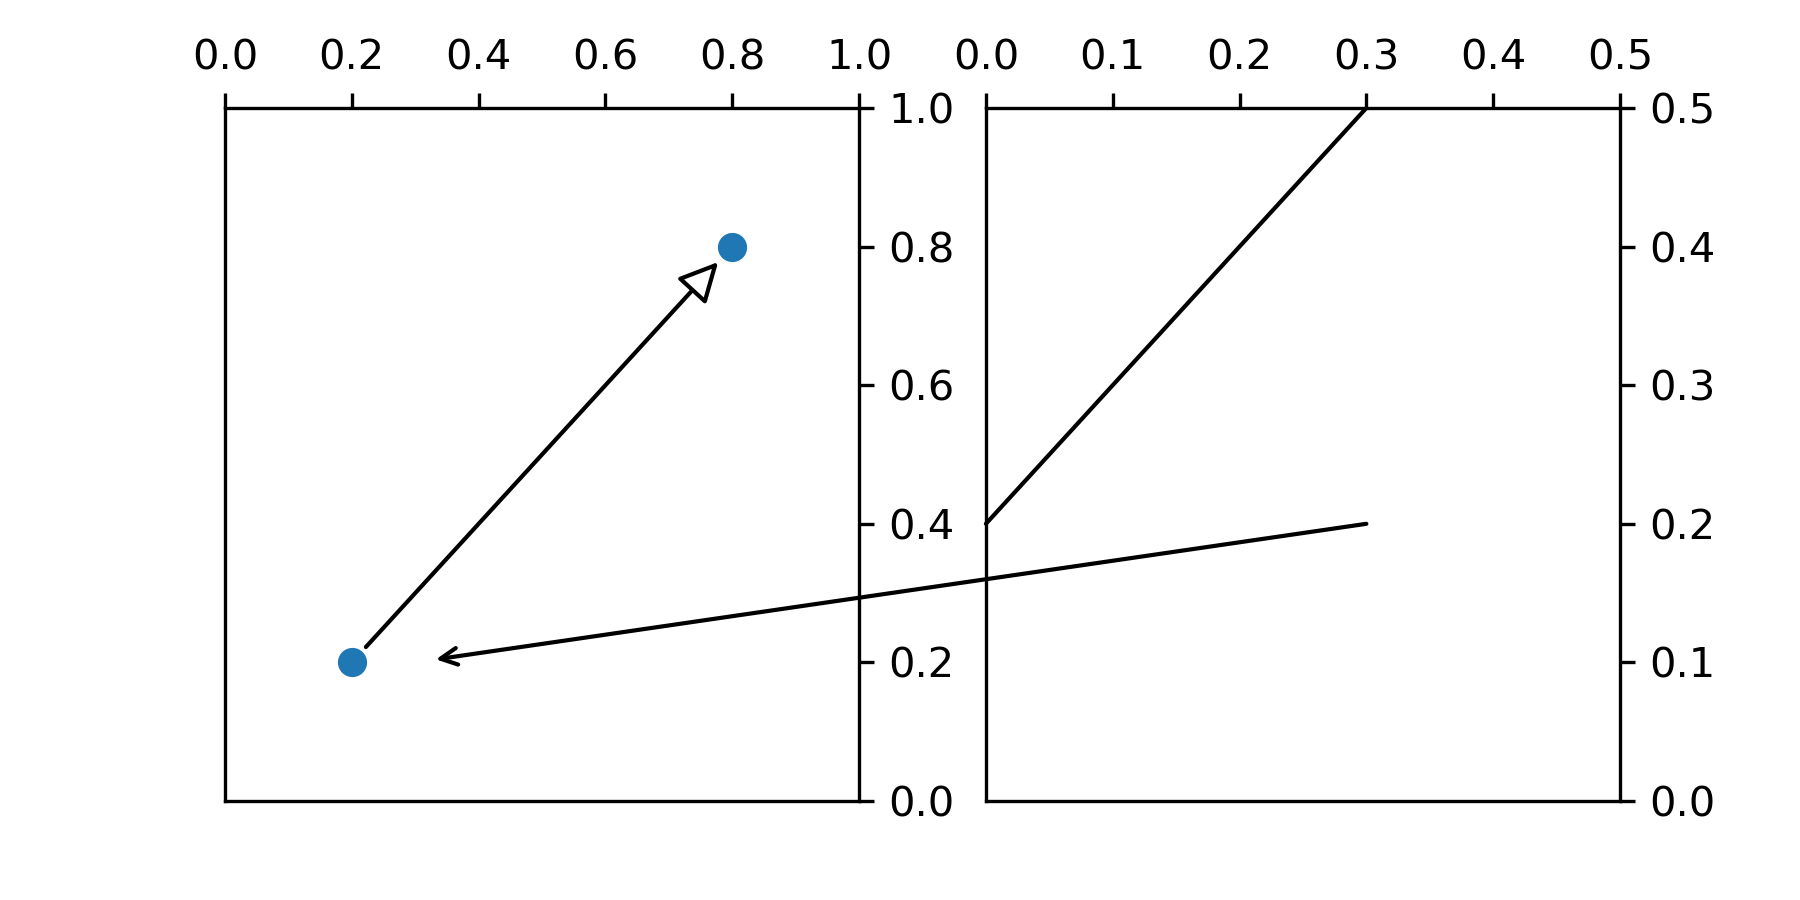
Connect Simple01
================
A `.ConnectionPatch` can be used to draw a line (possibly with arrow head)
between points defined in different coordinate systems and/or axes.
"""
...
... from matplotlib.patches import ConnectionPatch
... import matplotlib.pyplot as plt
...
... fig, (ax1, ax2) = plt.subplots(1, 2, figsize=(6, 3))
...
... # Draw a simple arrow between two points in axes coordinates
... # within a single axes.
... xyA = (0.2, 0.2)
... xyB = (0.8, 0.8)
... coordsA = "data"
... coordsB = "data"
... con = ConnectionPatch(xyA, xyB, coordsA, coordsB,
... arrowstyle="-|>", shrinkA=5, shrinkB=5,
... mutation_scale=20, fc="w")
... ax1.plot([xyA[0], xyB[0]], [xyA[1], xyB[1]], "o")
... ax1.add_artist(con)
...
... # Draw an arrow between the same point in data coordinates,
... # but in different axes.
... xy = (0.3, 0.2)
... con = ConnectionPatch(
... xyA=xy, coordsA=ax2.transData,
... xyB=xy, coordsB=ax1.transData,
... arrowstyle="->", shrinkB=5)
... fig.add_artist(con)
...
... # Draw a line between the different points, defined in different coordinate
... # systems.
... con = ConnectionPatch(
... # in axes coordinates
... xyA=(0.6, 1.0), coordsA=ax2.transAxes,
... # x in axes coordinates, y in data coordinates
... xyB=(0.0, 0.2), coordsB=ax2.get_yaxis_transform(),
... arrowstyle="-")
... ax2.add_artist(con)
...
... ax1.set_xlim(0, 1)
... ax1.set_ylim(0, 1)
... ax2.set_xlim(0, .5)
... ax2.set_ylim(0, .5)
...
... plt.show()
...