>>> """
==================
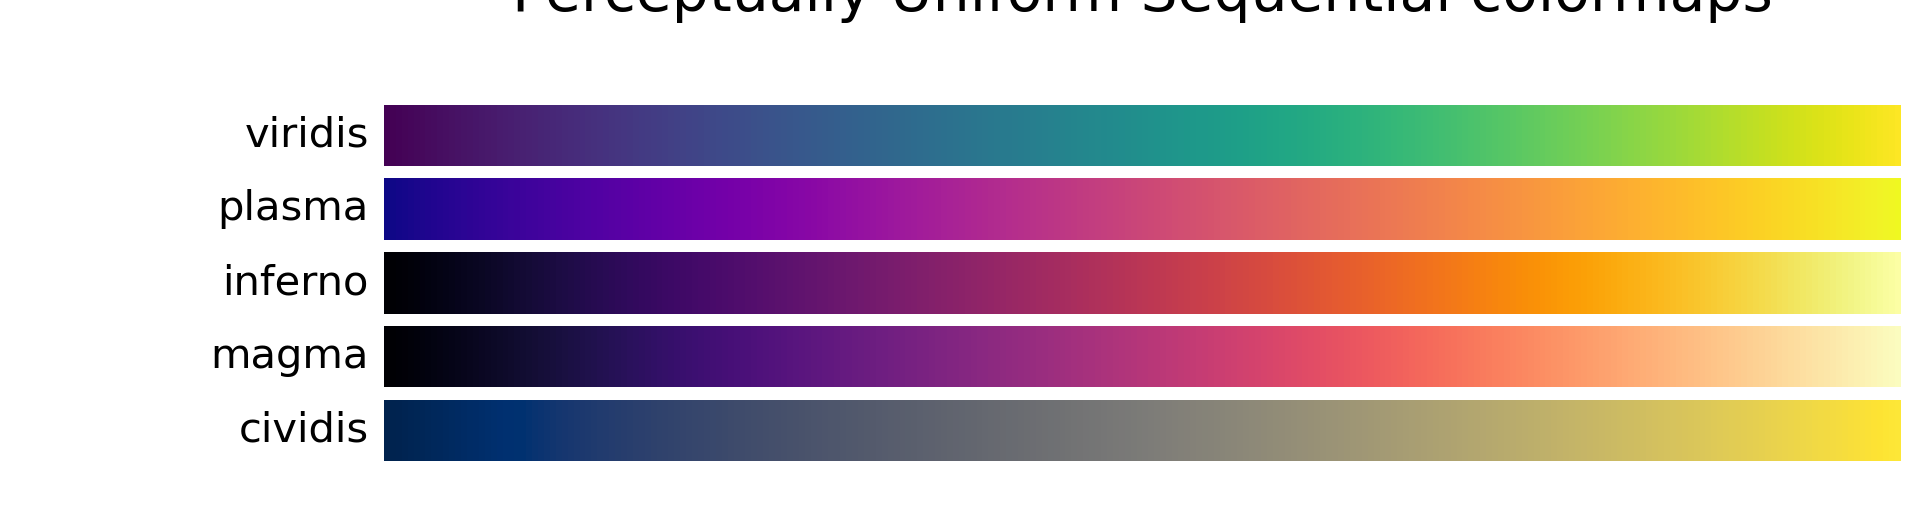
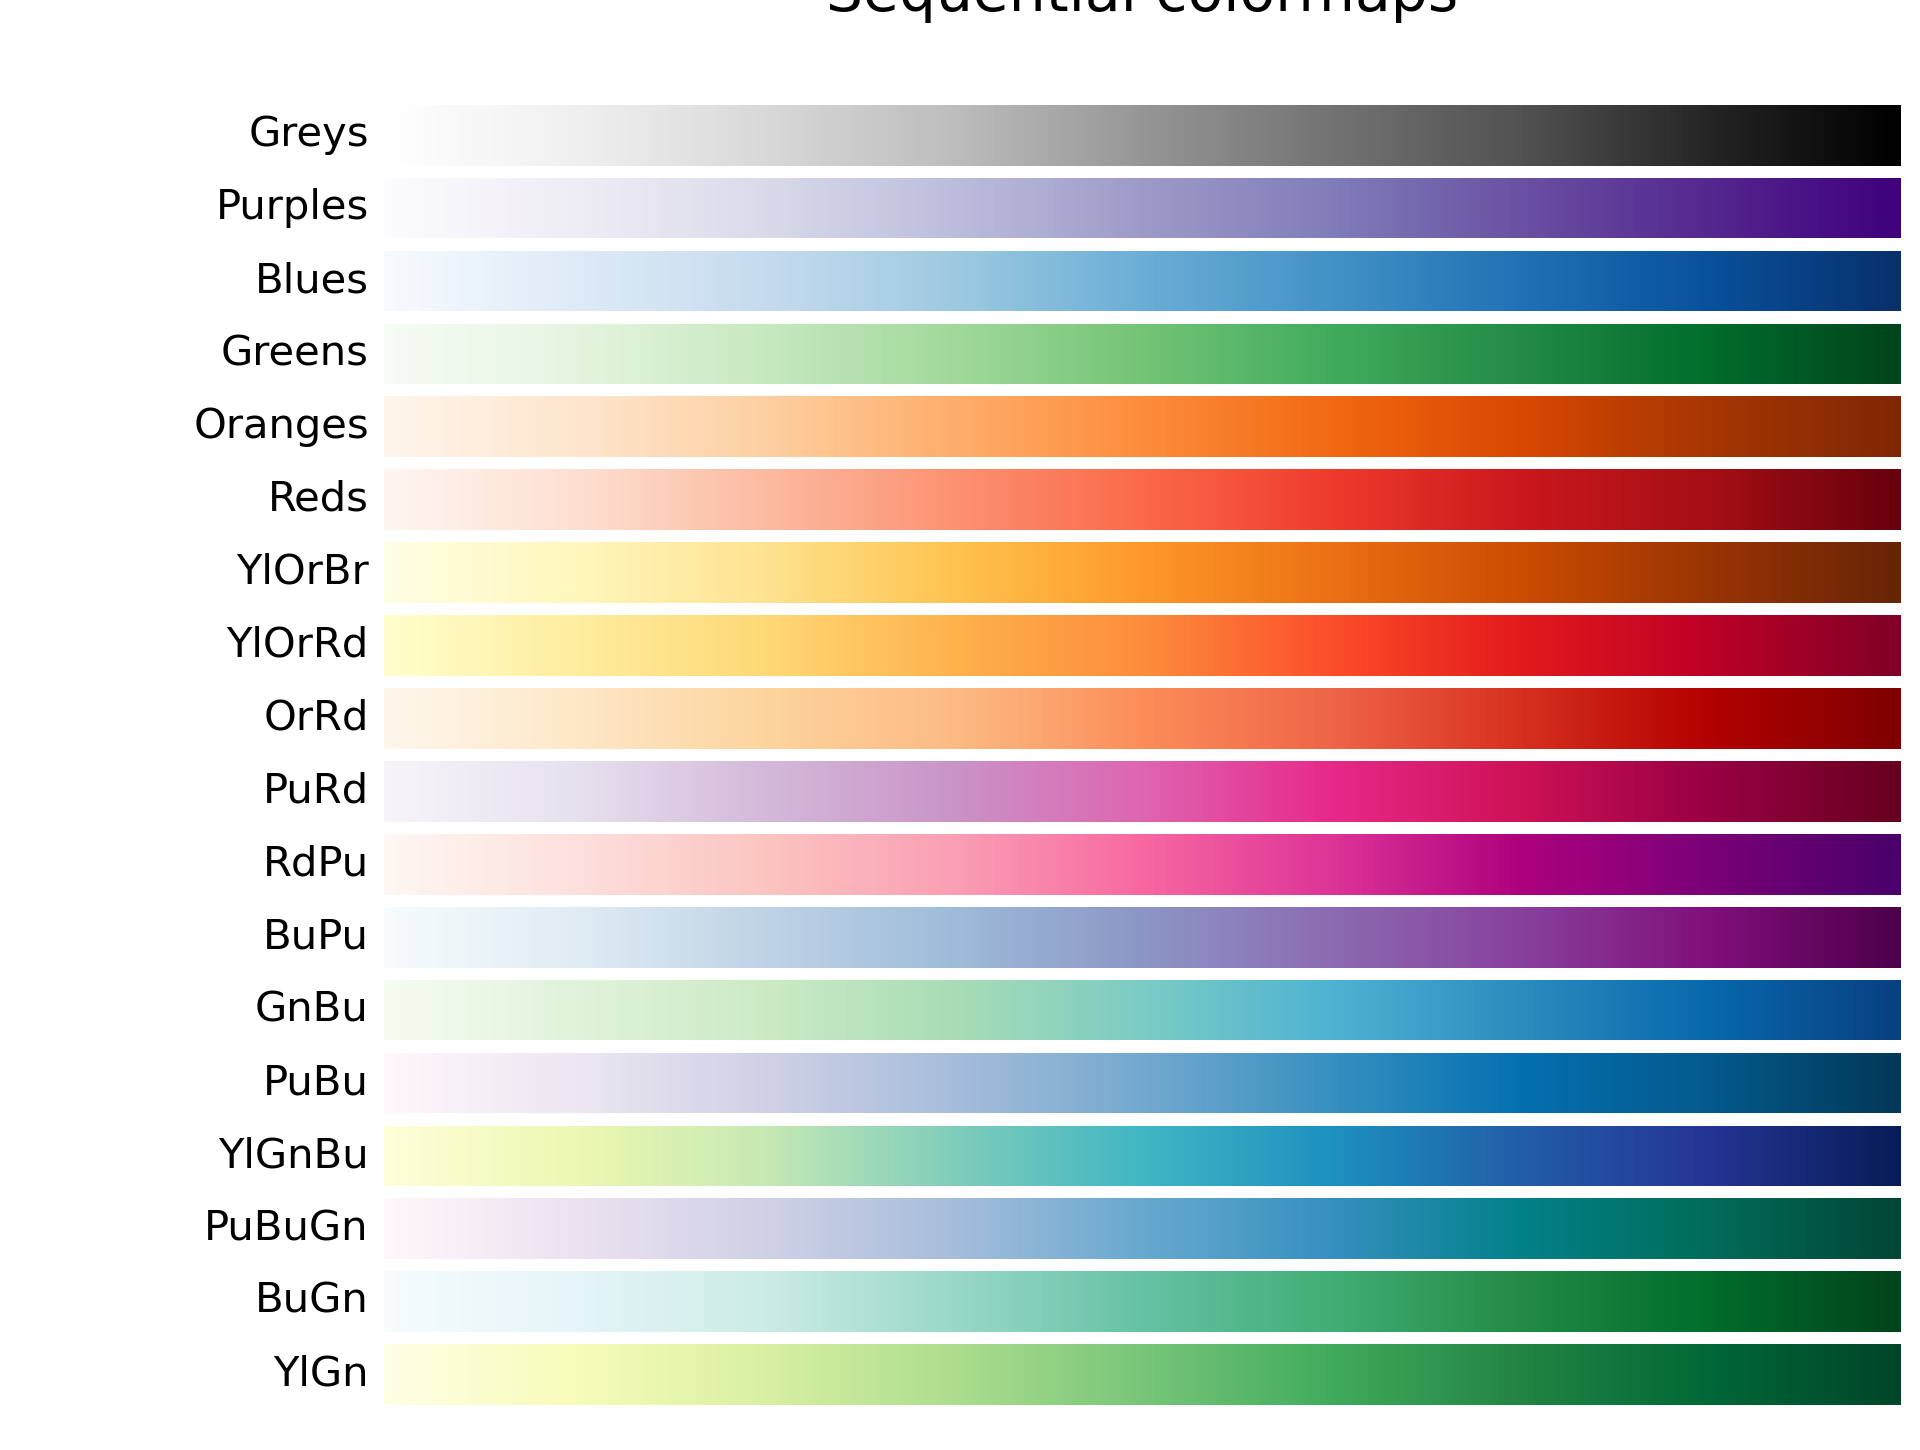
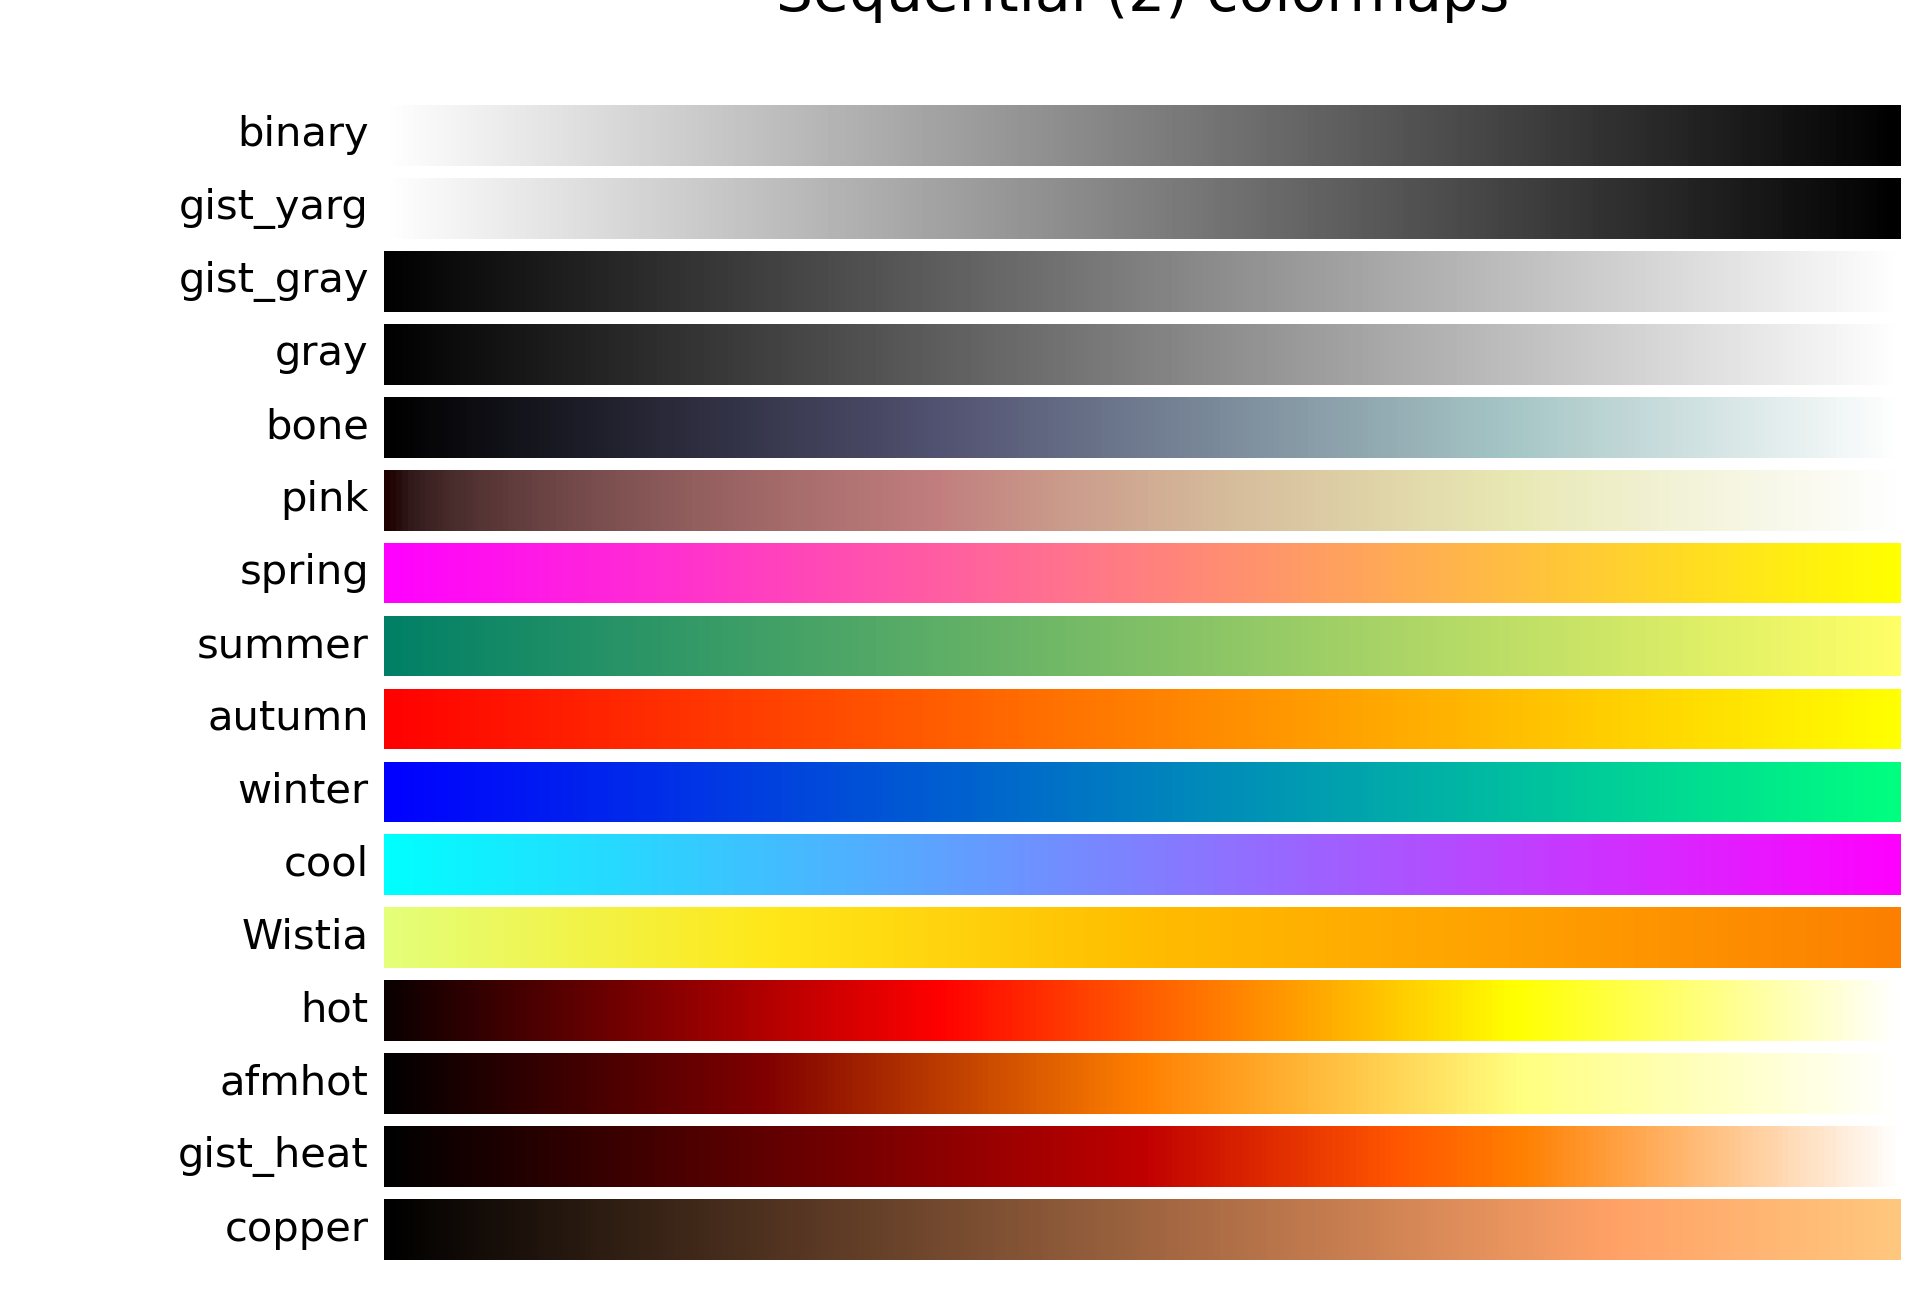
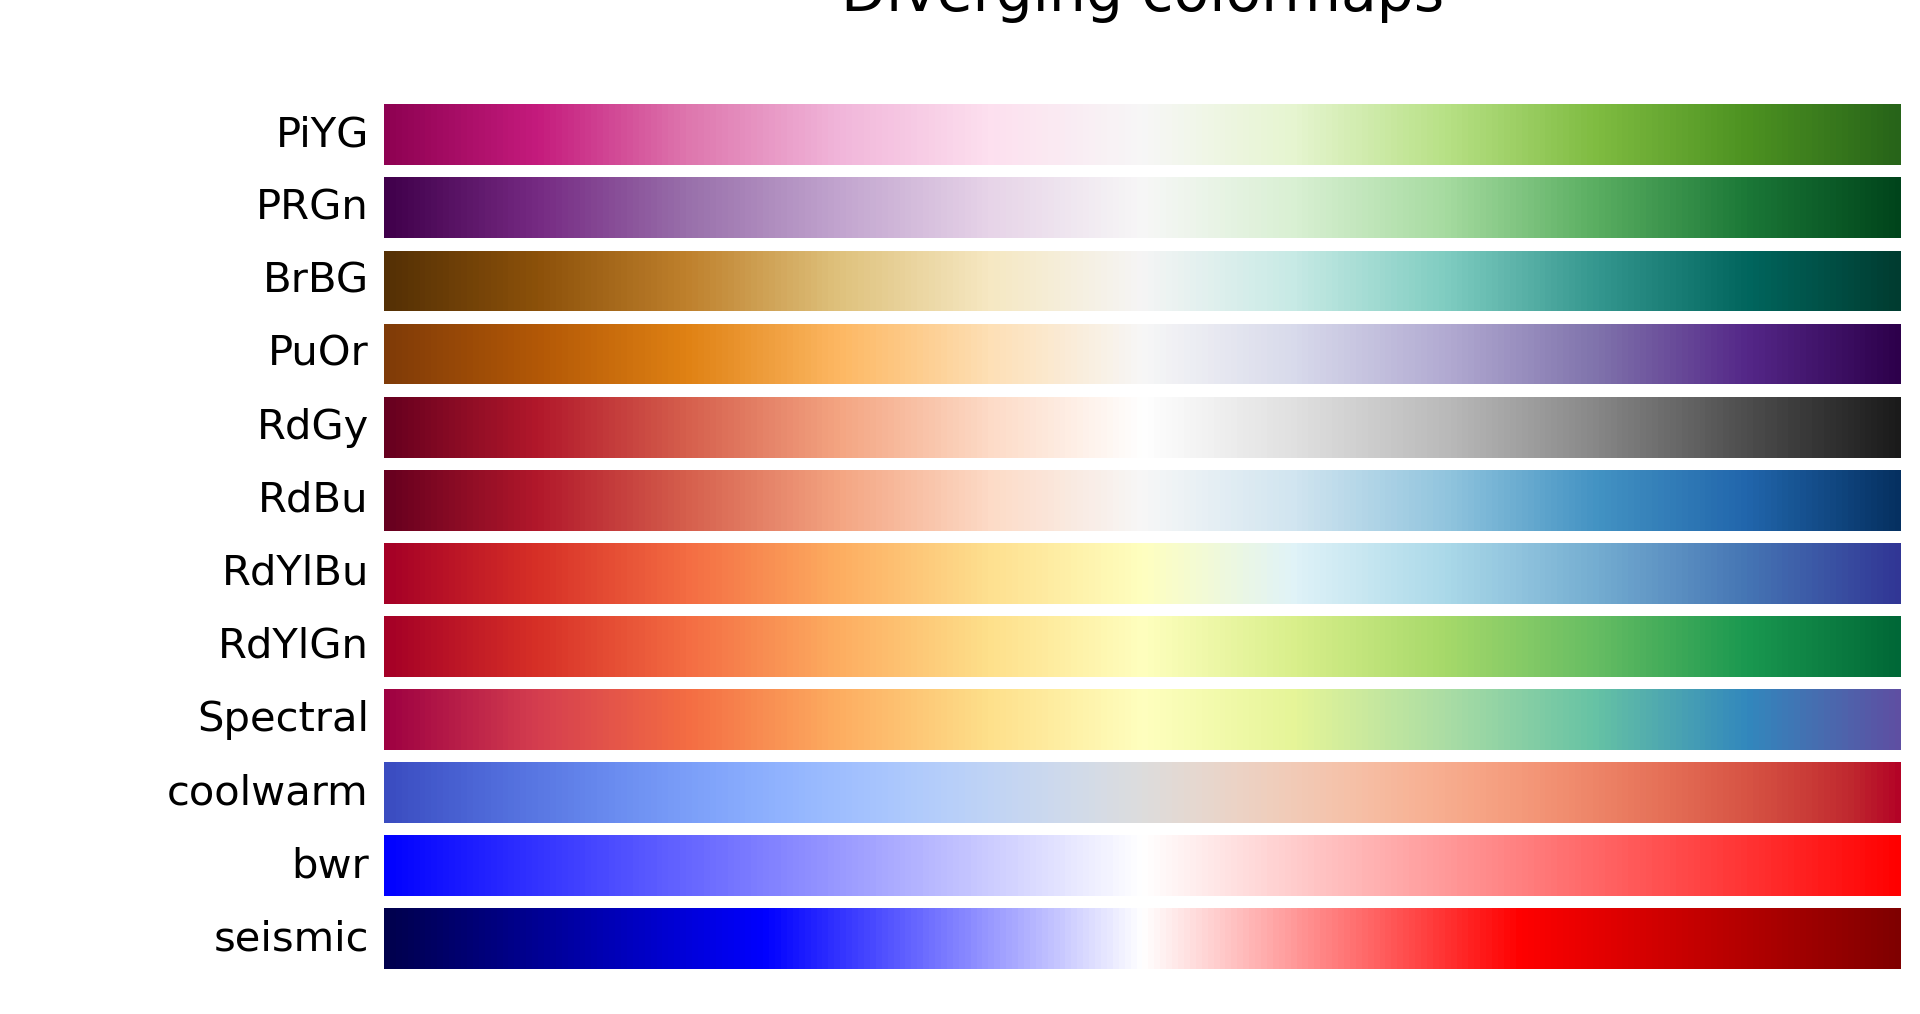
Colormap reference
==================
Reference for colormaps included with Matplotlib.
A reversed version of each of these colormaps is available by appending
``_r`` to the name, e.g., ``viridis_r``.
See :doc:`/tutorials/colors/colormaps` for an in-depth discussion about
colormaps, including colorblind-friendliness.
"""
...
... import numpy as np
... import matplotlib.pyplot as plt
...
...
... cmaps = [('Perceptually Uniform Sequential', [
... 'viridis', 'plasma', 'inferno', 'magma', 'cividis']),
... ('Sequential', [
... 'Greys', 'Purples', 'Blues', 'Greens', 'Oranges', 'Reds',
... 'YlOrBr', 'YlOrRd', 'OrRd', 'PuRd', 'RdPu', 'BuPu',
... 'GnBu', 'PuBu', 'YlGnBu', 'PuBuGn', 'BuGn', 'YlGn']),
... ('Sequential (2)', [
... 'binary', 'gist_yarg', 'gist_gray', 'gray', 'bone', 'pink',
... 'spring', 'summer', 'autumn', 'winter', 'cool', 'Wistia',
... 'hot', 'afmhot', 'gist_heat', 'copper']),
... ('Diverging', [
... 'PiYG', 'PRGn', 'BrBG', 'PuOr', 'RdGy', 'RdBu',
... 'RdYlBu', 'RdYlGn', 'Spectral', 'coolwarm', 'bwr', 'seismic']),
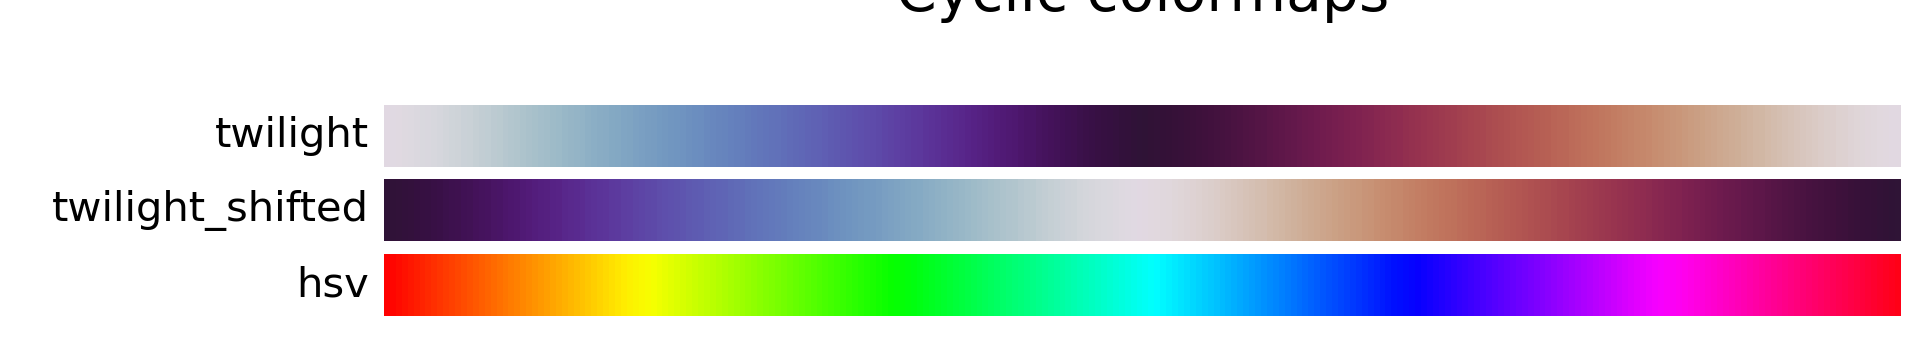
... ('Cyclic', ['twilight', 'twilight_shifted', 'hsv']),
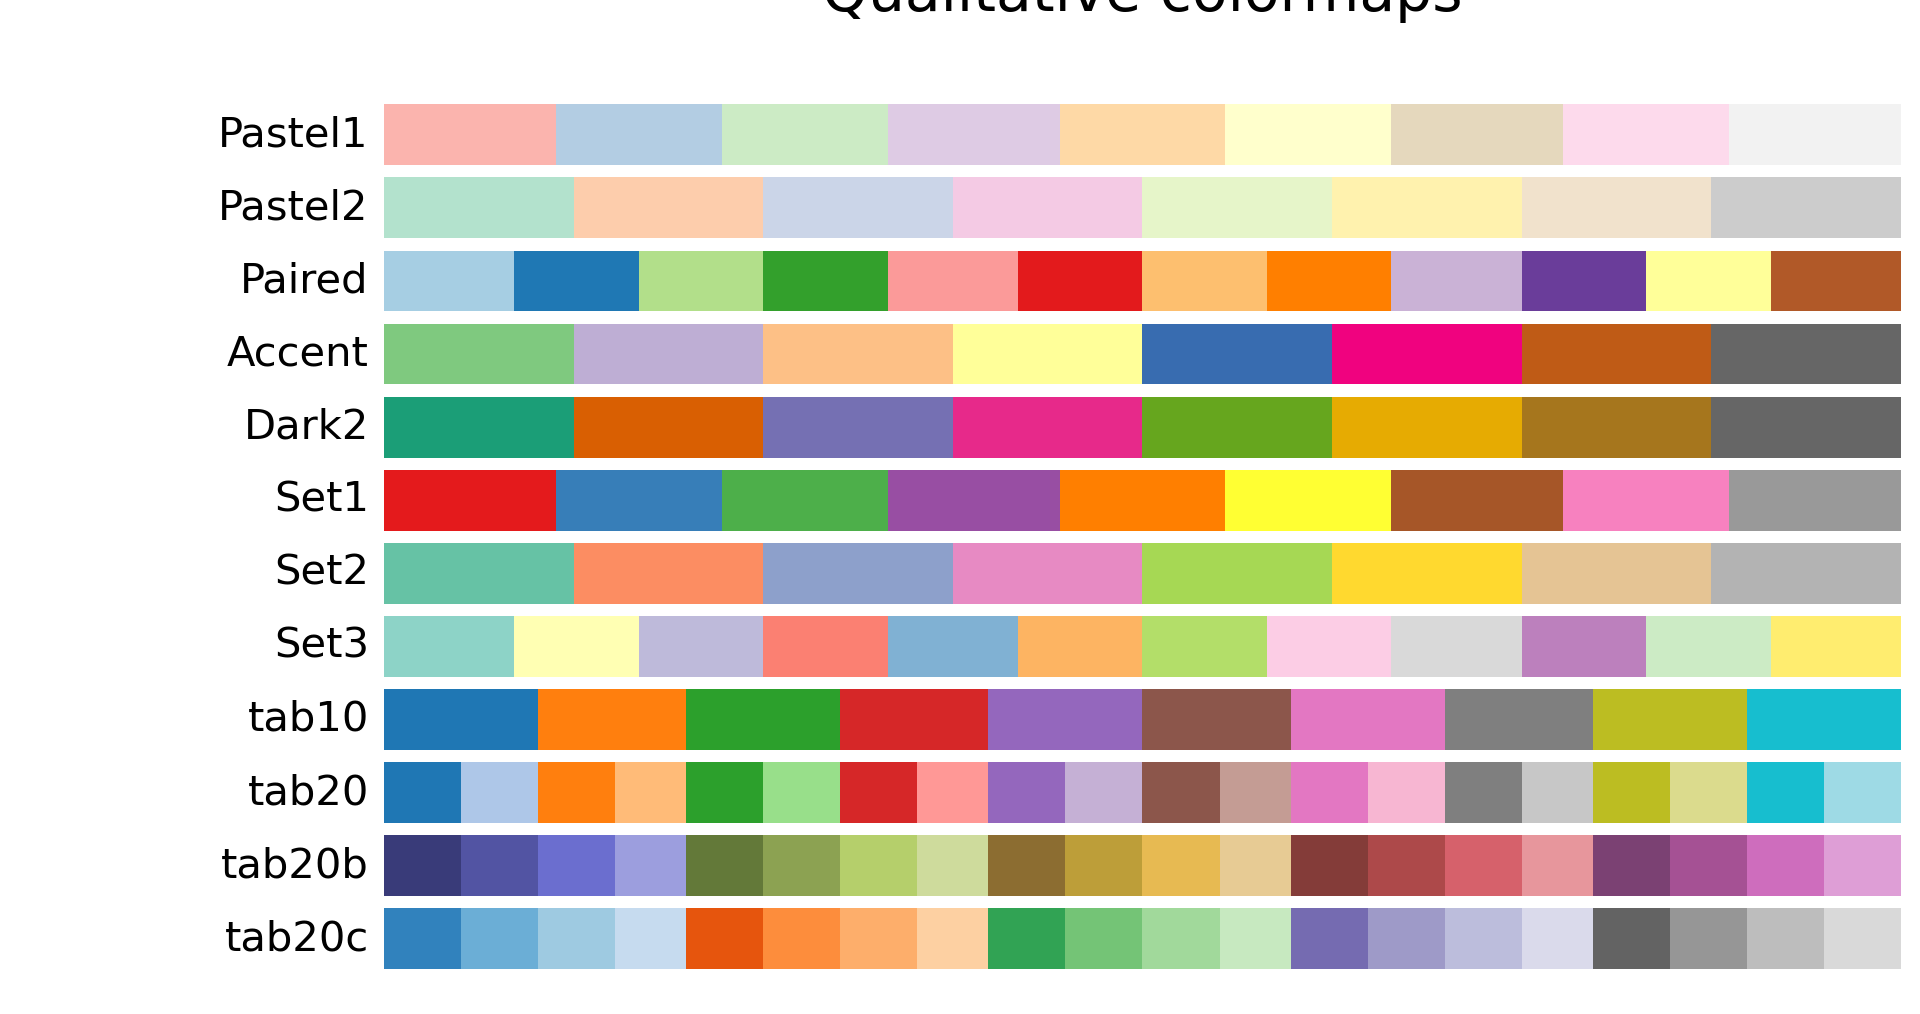
... ('Qualitative', [
... 'Pastel1', 'Pastel2', 'Paired', 'Accent',
... 'Dark2', 'Set1', 'Set2', 'Set3',
... 'tab10', 'tab20', 'tab20b', 'tab20c']),
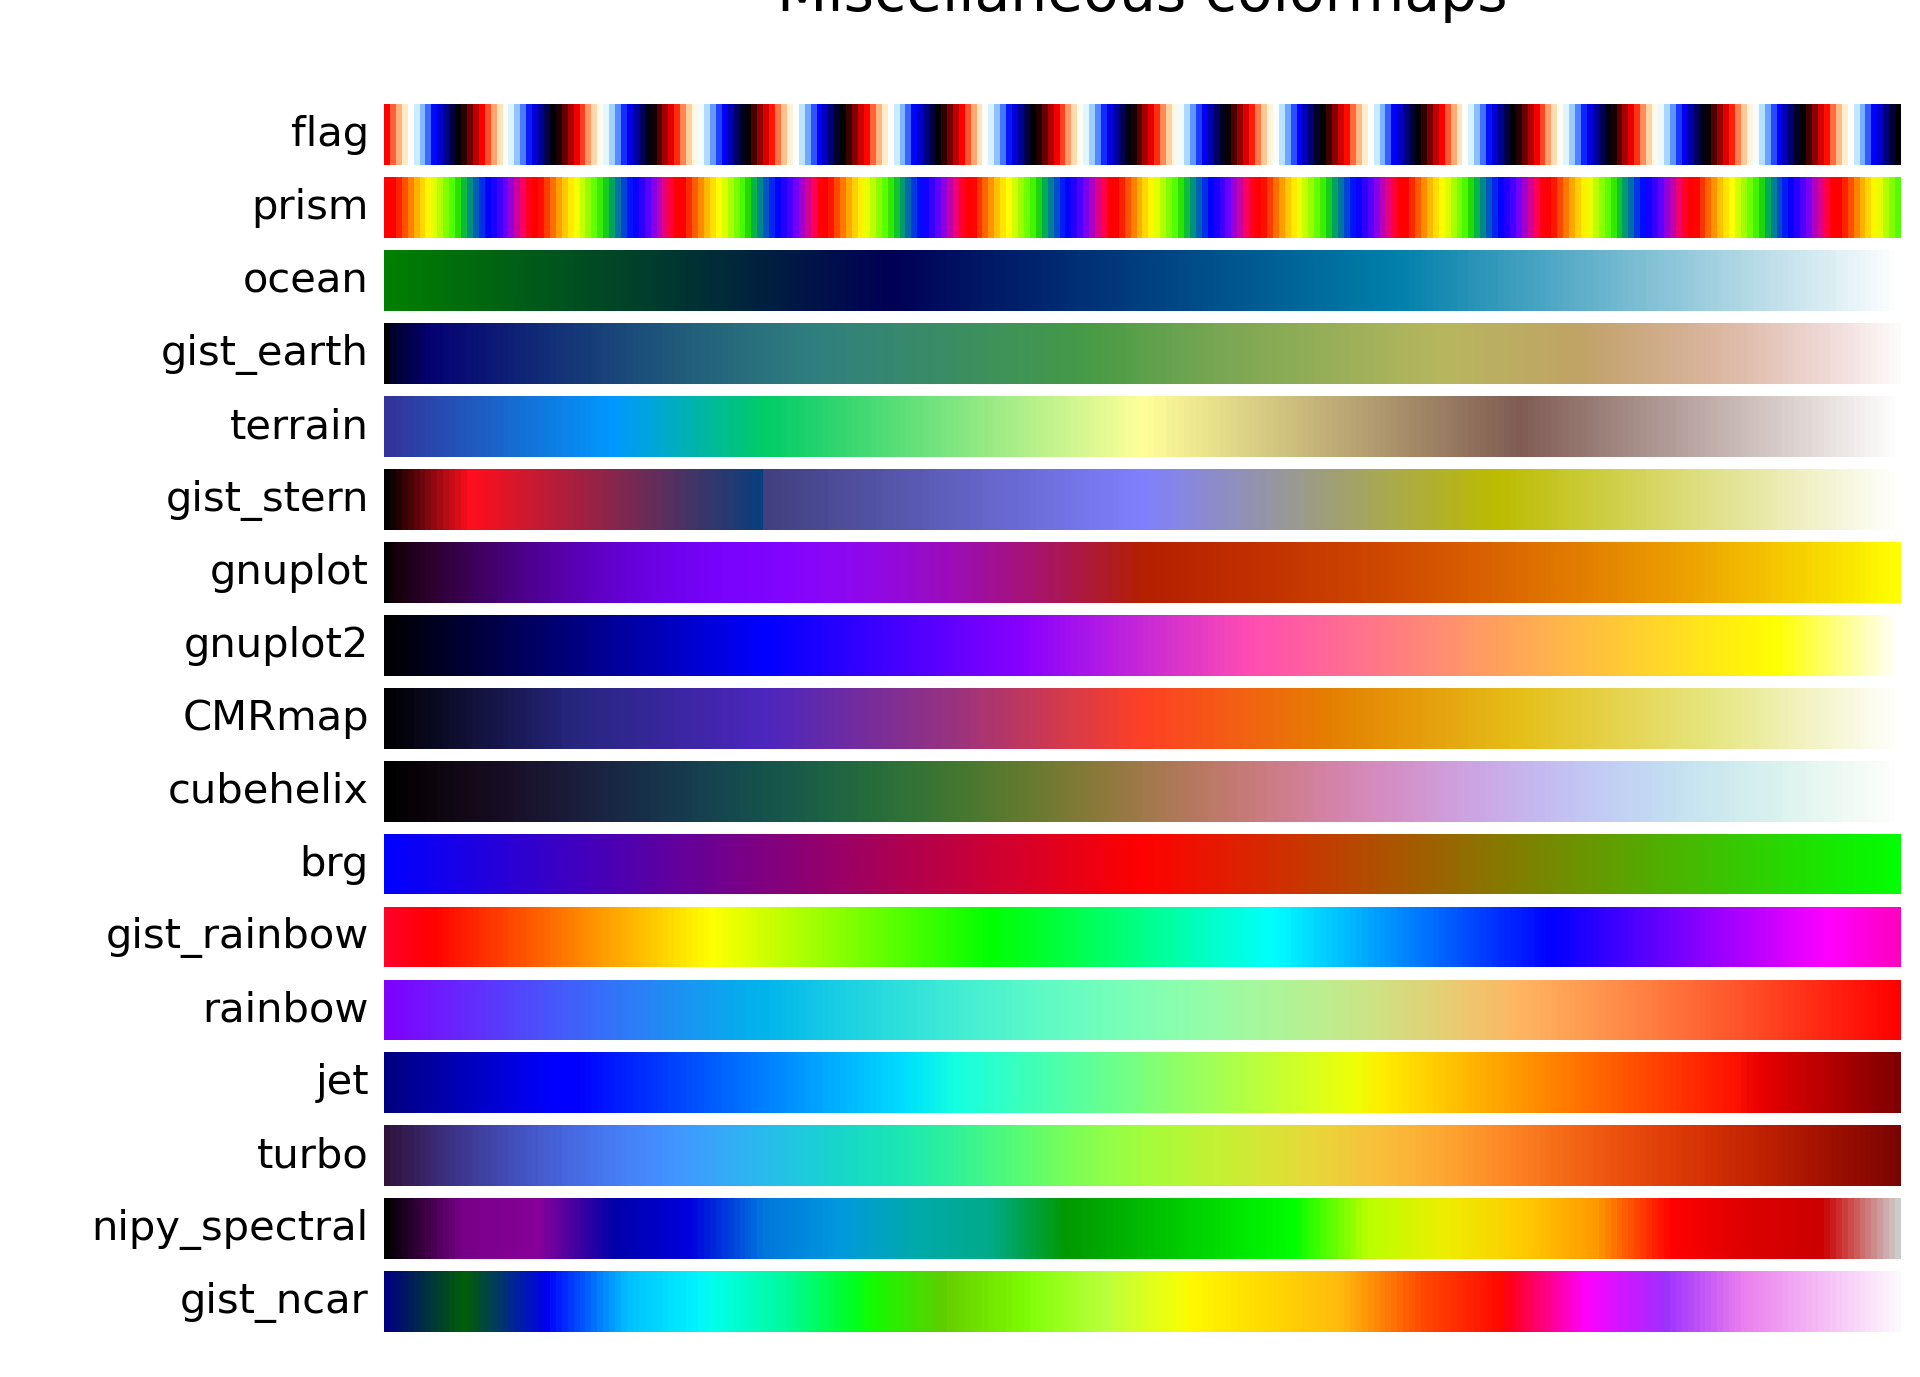
... ('Miscellaneous', [
... 'flag', 'prism', 'ocean', 'gist_earth', 'terrain', 'gist_stern',
... 'gnuplot', 'gnuplot2', 'CMRmap', 'cubehelix', 'brg',
... 'gist_rainbow', 'rainbow', 'jet', 'turbo', 'nipy_spectral',
... 'gist_ncar'])]
...
...
... gradient = np.linspace(0, 1, 256)
... gradient = np.vstack((gradient, gradient))
...
...
... def plot_color_gradients(cmap_category, cmap_list):
... # Create figure and adjust figure height to number of colormaps
... nrows = len(cmap_list)
... figh = 0.35 + 0.15 + (nrows + (nrows-1)*0.1)*0.22
... fig, axs = plt.subplots(nrows=nrows, figsize=(6.4, figh))
... fig.subplots_adjust(top=1-.35/figh, bottom=.15/figh, left=0.2, right=0.99)
...
... axs[0].set_title(cmap_category + ' colormaps', fontsize=14)
...
... for ax, cmap_name in zip(axs, cmap_list):
... ax.imshow(gradient, aspect='auto', cmap=cmap_name)
... ax.text(-.01, .5, cmap_name, va='center', ha='right', fontsize=10,
... transform=ax.transAxes)
...
... # Turn off *all* ticks & spines, not just the ones with colormaps.
... for ax in axs:
... ax.set_axis_off()
...
...
... for cmap_category, cmap_list in cmaps:
... plot_color_gradients(cmap_category, cmap_list)
...
... plt.show()
...
... #############################################################################
... #
... # .. admonition:: References
... #
... # The use of the following functions, methods, classes and modules is shown
... # in this example:
... #
... # - `matplotlib.colors`
... # - `matplotlib.axes.Axes.imshow`
... # - `matplotlib.figure.Figure.text`
... # - `matplotlib.axes.Axes.set_axis_off`
...