>>> """
========================================
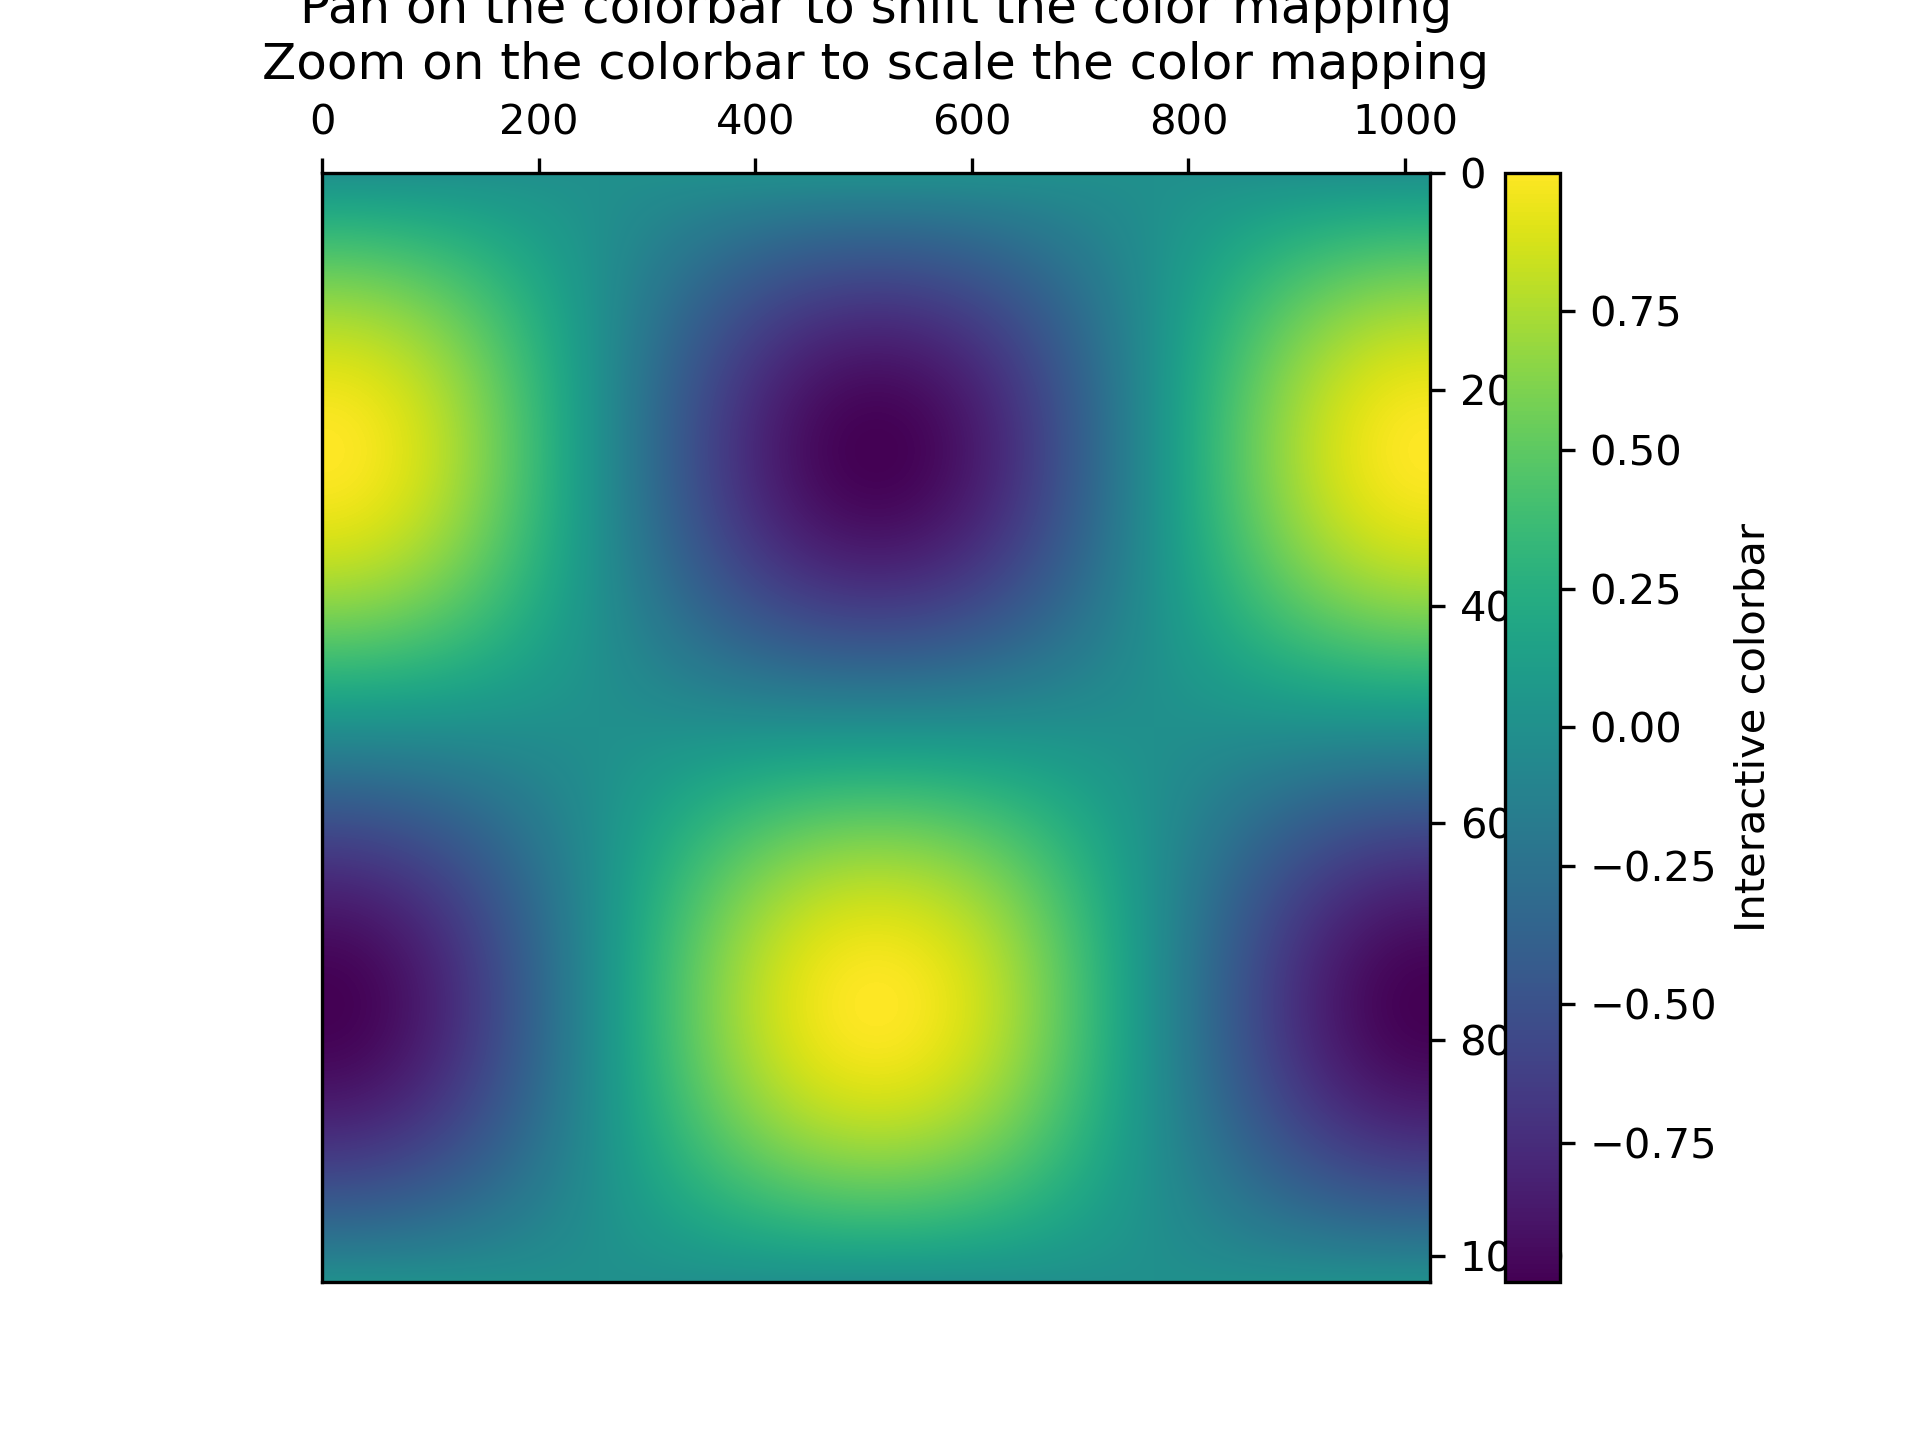
Interactive Adjustment of Colormap Range
========================================
Demonstration of how a colorbar can be used to interactively adjust the
range of colormapping on an image. To use the interactive feature, you must
be in either zoom mode (magnifying glass toolbar button) or
pan mode (4-way arrow toolbar button) and click inside the colorbar.
When zooming, the bounding box of the zoom region defines the new vmin and
vmax of the norm. Zooming using the right mouse button will expand the
vmin and vmax proportionally to the selected region, in the same manner that
one can zoom out on an axis. When panning, the vmin and vmax of the norm are
both shifted according to the direction of movement. The
Home/Back/Forward buttons can also be used to get back to a previous state.
"""
... import matplotlib.pyplot as plt
... import numpy as np
...
... t = np.linspace(0, 2 * np.pi, 1024)
... data2d = np.sin(t)[:, np.newaxis] * np.cos(t)[np.newaxis, :]
...
... fig, ax = plt.subplots()
... im = ax.imshow(data2d)
... ax.set_title('Pan on the colorbar to shift the color mapping\n'
... 'Zoom on the colorbar to scale the color mapping')
...
... fig.colorbar(im, ax=ax, label='Interactive colorbar')
...
... plt.show()
...