>>> """
==========
Color Demo
==========
Matplotlib recognizes the following formats to specify a color:
1) an RGB or RGBA tuple of float values in ``[0, 1]`` (e.g. ``(0.1, 0.2, 0.5)``
or ``(0.1, 0.2, 0.5, 0.3)``). RGBA is short for Red, Green, Blue, Alpha;
2) a hex RGB or RGBA string (e.g., ``'#0F0F0F'`` or ``'#0F0F0F0F'``);
3) a shorthand hex RGB or RGBA string, equivalent to the hex RGB or RGBA
string obtained by duplicating each character, (e.g., ``'#abc'``, equivalent
to ``'#aabbcc'``, or ``'#abcd'``, equivalent to ``'#aabbccdd'``);
4) a string representation of a float value in ``[0, 1]`` inclusive for gray
level (e.g., ``'0.5'``);
5) a single letter string, i.e. one of
``{'b', 'g', 'r', 'c', 'm', 'y', 'k', 'w'}``, which are short-hand notations
for shades of blue, green, red, cyan, magenta, yellow, black, and white;
6) a X11/CSS4 ("html") color name, e.g. ``"blue"``;
7) a name from the `xkcd color survey <https://xkcd.com/color/rgb/>`__,
prefixed with ``'xkcd:'`` (e.g., ``'xkcd:sky blue'``);
8) a "Cn" color spec, i.e. ``'C'`` followed by a number, which is an index into
the default property cycle (:rc:`axes.prop_cycle`); the indexing is intended
to occur at rendering time, and defaults to black if the cycle does not
include color.
9) one of ``{'tab:blue', 'tab:orange', 'tab:green', 'tab:red', 'tab:purple',
'tab:brown', 'tab:pink', 'tab:gray', 'tab:olive', 'tab:cyan'}`` which are
the Tableau Colors from the 'tab10' categorical palette (which is the
default color cycle);
For more information on colors in matplotlib see
* the :doc:`/tutorials/colors/colors` tutorial;
* the `matplotlib.colors` API;
* the :doc:`/gallery/color/named_colors` example.
"""
...
... import matplotlib.pyplot as plt
... import numpy as np
...
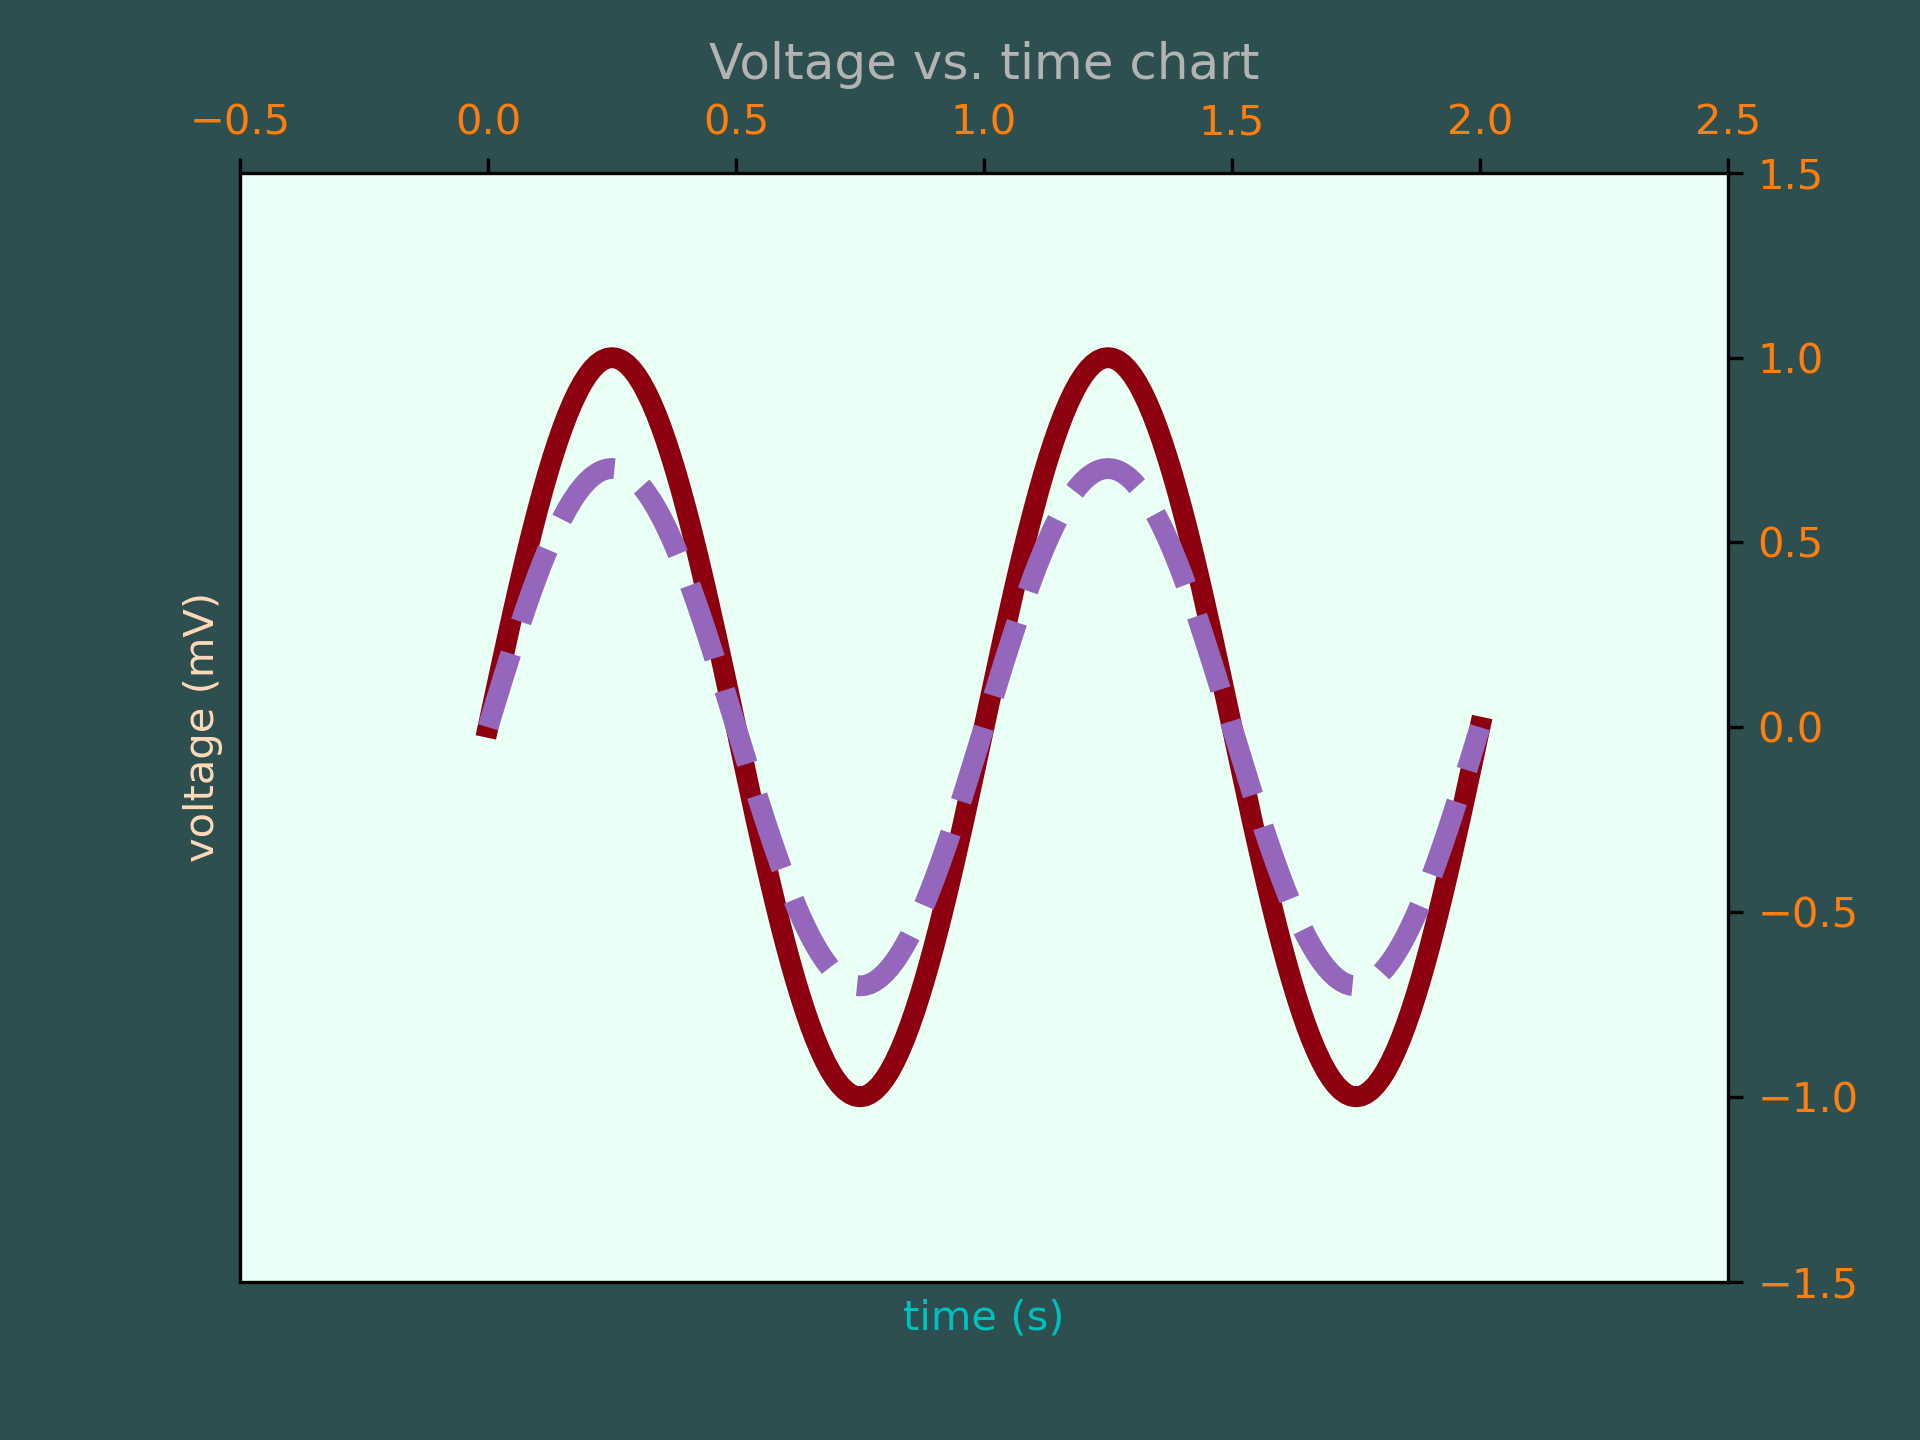
... t = np.linspace(0.0, 2.0, 201)
... s = np.sin(2 * np.pi * t)
...
... # 1) RGB tuple:
... fig, ax = plt.subplots(facecolor=(.18, .31, .31))
... # 2) hex string:
... ax.set_facecolor('#eafff5')
... # 3) gray level string:
... ax.set_title('Voltage vs. time chart', color='0.7')
... # 4) single letter color string
... ax.set_xlabel('time (s)', color='c')
... # 5) a named color:
... ax.set_ylabel('voltage (mV)', color='peachpuff')
... # 6) a named xkcd color:
... ax.plot(t, s, 'xkcd:crimson')
... # 7) Cn notation:
... ax.plot(t, .7*s, color='C4', linestyle='--')
... # 8) tab notation:
... ax.tick_params(labelcolor='tab:orange')
...
...
... plt.show()
...
... #############################################################################
... #
... # .. admonition:: References
... #
... # The use of the following functions, methods, classes and modules is shown
... # in this example:
... #
... # - `matplotlib.colors`
... # - `matplotlib.axes.Axes.plot`
... # - `matplotlib.axes.Axes.set_facecolor`
... # - `matplotlib.axes.Axes.set_title`
... # - `matplotlib.axes.Axes.set_xlabel`
... # - `matplotlib.axes.Axes.set_ylabel`
... # - `matplotlib.axes.Axes.tick_params`
...