>>> """
====================================
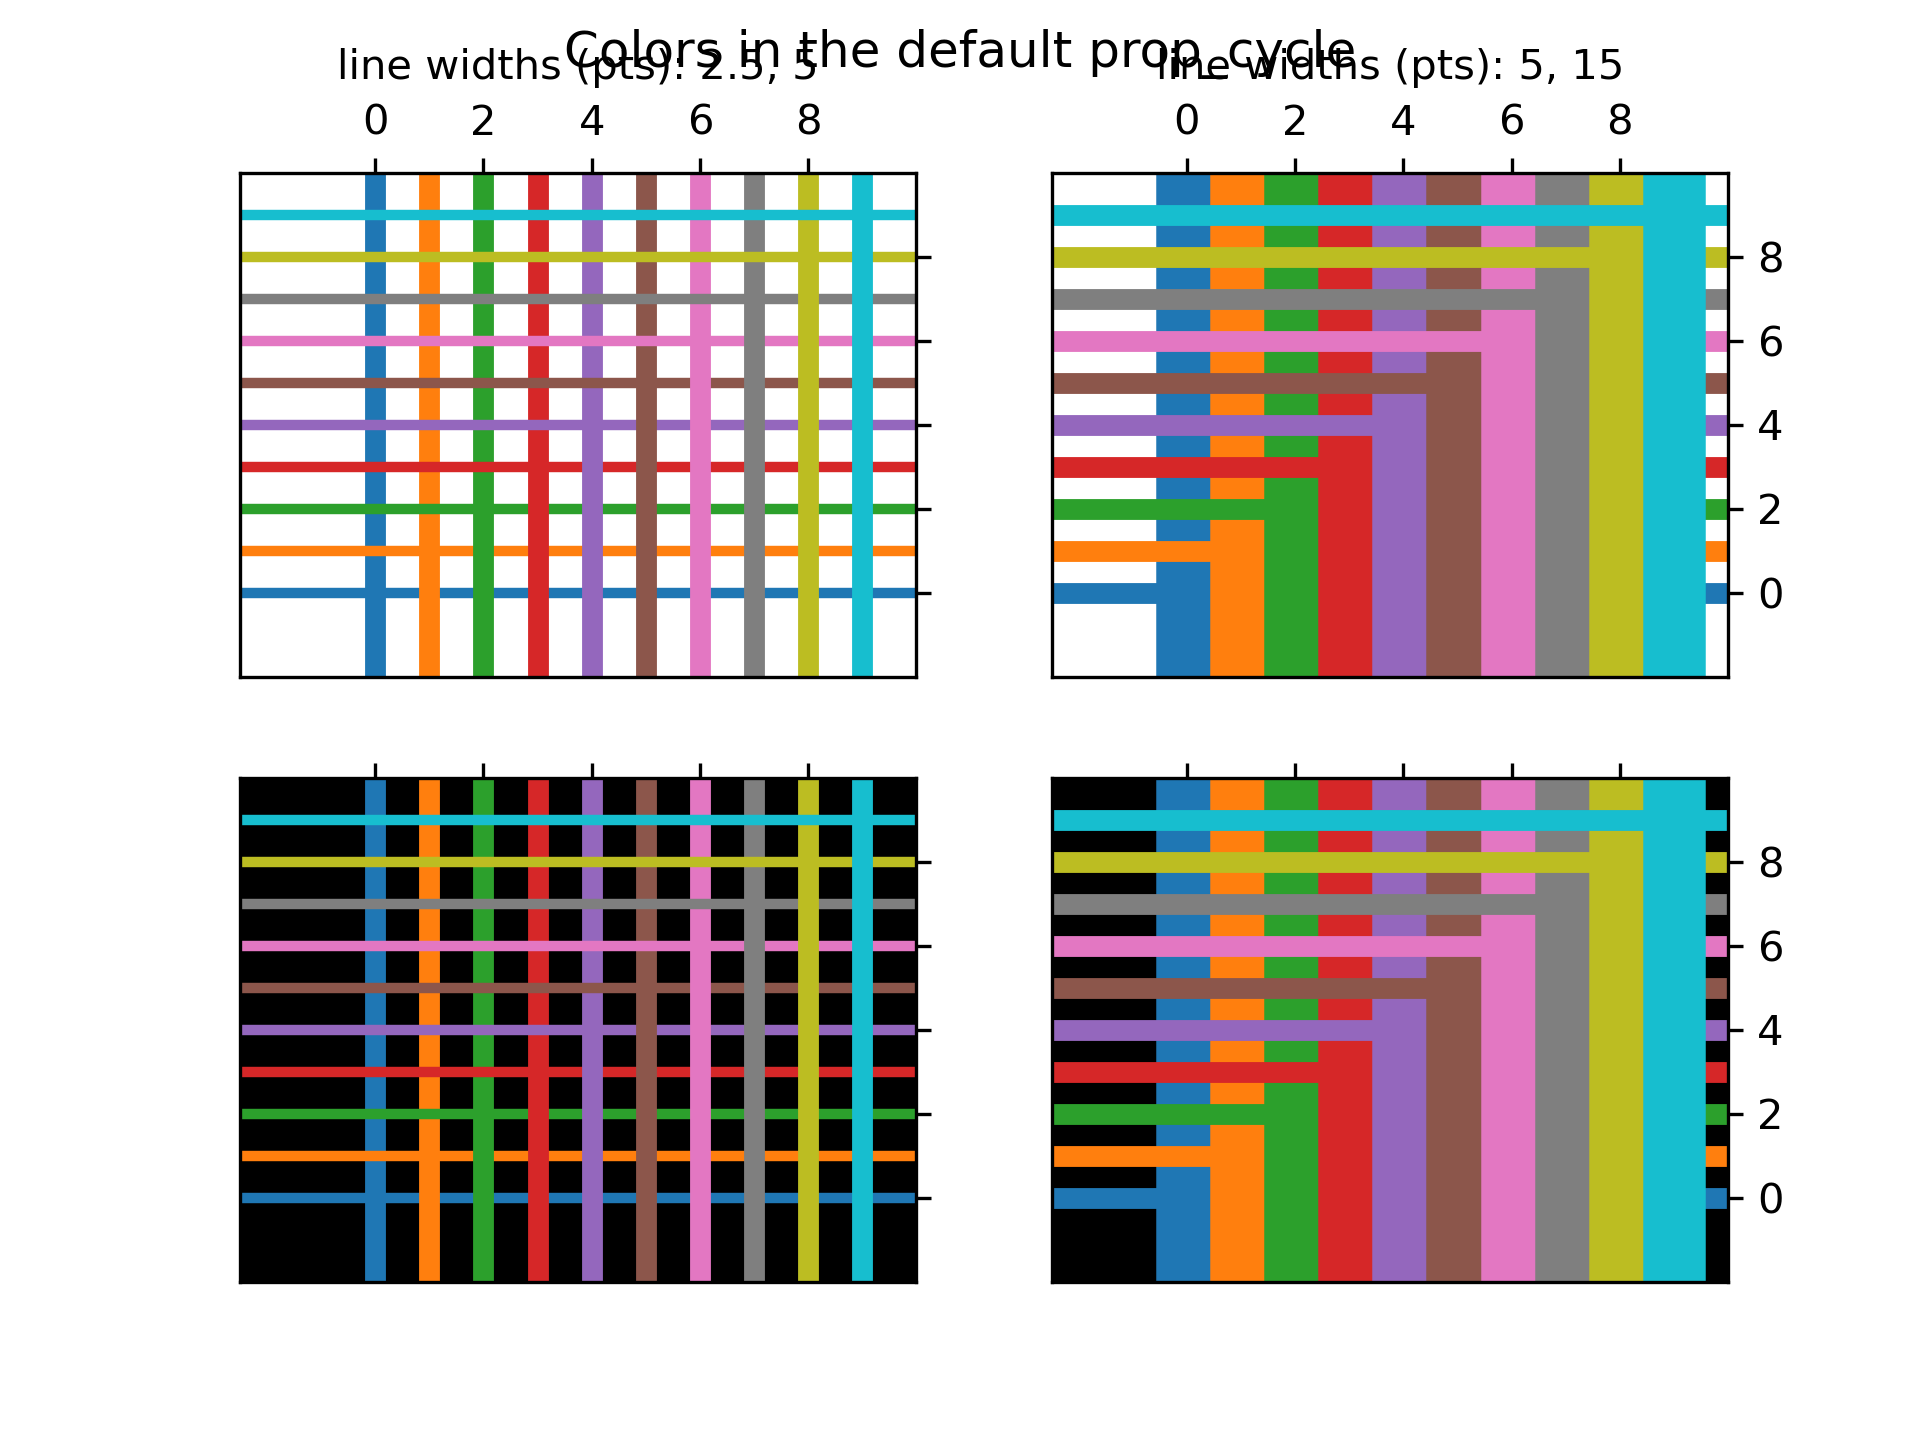
Colors in the default property cycle
====================================
Display the colors from the default prop_cycle, which is obtained from the
:doc:`rc parameters</tutorials/introductory/customizing>`.
"""
... import numpy as np
... import matplotlib.pyplot as plt
...
...
... prop_cycle = plt.rcParams['axes.prop_cycle']
... colors = prop_cycle.by_key()['color']
...
... lwbase = plt.rcParams['lines.linewidth']
... thin = lwbase / 2
... thick = lwbase * 3
...
... fig, axs = plt.subplots(nrows=2, ncols=2, sharex=True, sharey=True)
... for icol in range(2):
... if icol == 0:
... lwx, lwy = thin, lwbase
... else:
... lwx, lwy = lwbase, thick
... for irow in range(2):
... for i, color in enumerate(colors):
... axs[irow, icol].axhline(i, color=color, lw=lwx)
... axs[irow, icol].axvline(i, color=color, lw=lwy)
...
... axs[1, icol].set_facecolor('k')
... axs[1, icol].xaxis.set_ticks(np.arange(0, 10, 2))
... axs[0, icol].set_title('line widths (pts): %g, %g' % (lwx, lwy),
... fontsize='medium')
...
... for irow in range(2):
... axs[irow, 0].yaxis.set_ticks(np.arange(0, 10, 2))
...
... fig.suptitle('Colors in the default prop_cycle', fontsize='large')
...
... plt.show()
...
... #############################################################################
... #
... # .. admonition:: References
... #
... # The use of the following functions, methods, classes and modules is shown
... # in this example:
... #
... # - `matplotlib.axes.Axes.axhline` / `matplotlib.pyplot.axhline`
... # - `matplotlib.axes.Axes.axvline` / `matplotlib.pyplot.axvline`
... # - `matplotlib.axes.Axes.set_facecolor`
... # - `matplotlib.figure.Figure.suptitle`
...