>>> """
================
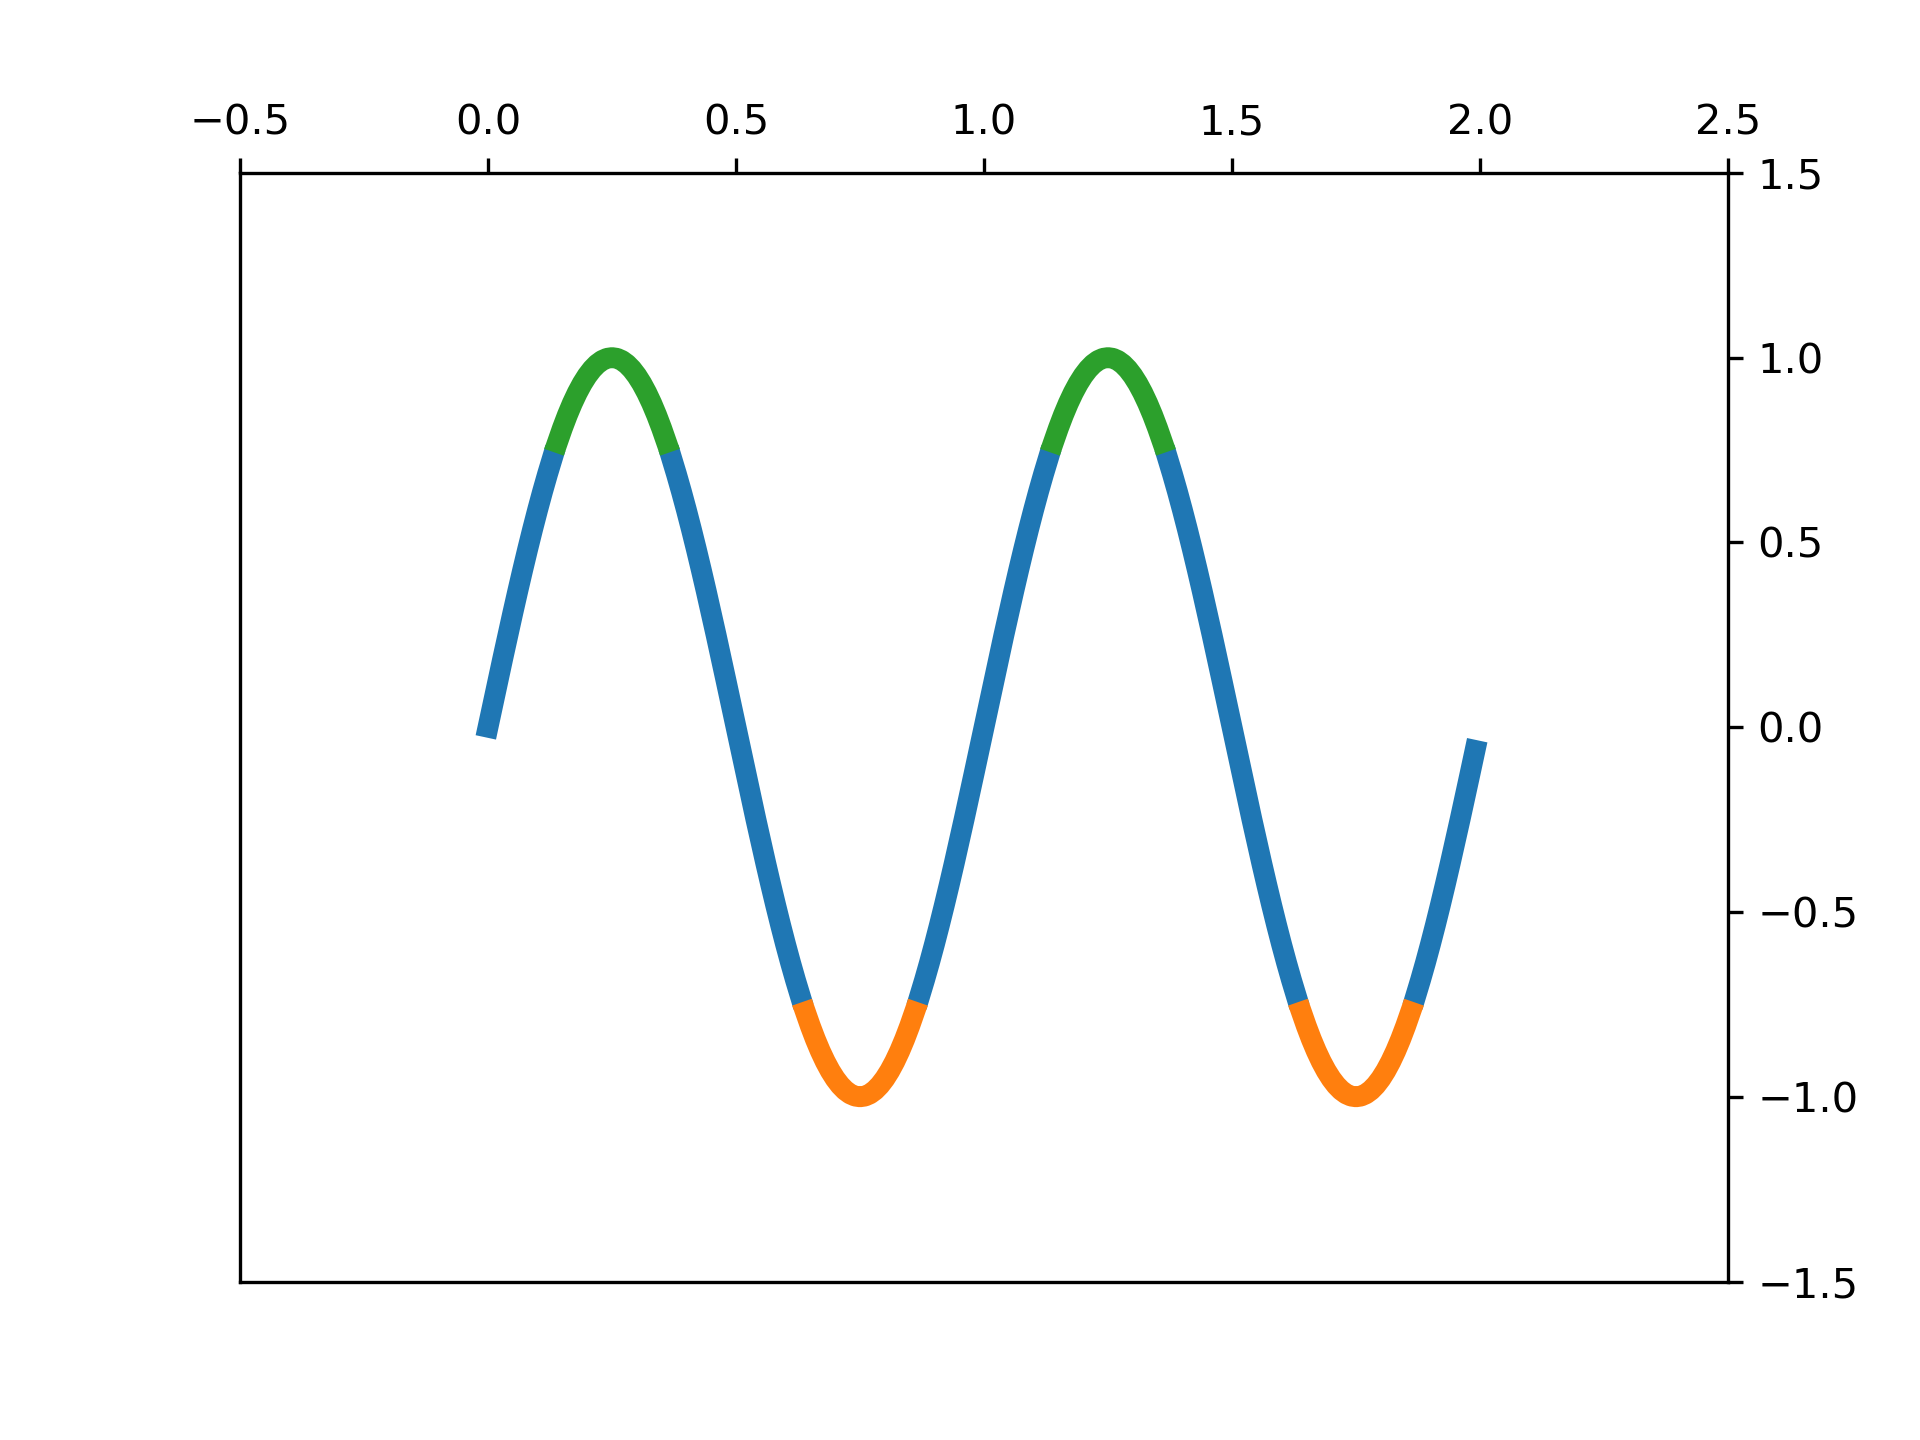
Color by y-value
================
Use masked arrays to plot a line with different colors by y-value.
"""
... import numpy as np
... import matplotlib.pyplot as plt
...
... t = np.arange(0.0, 2.0, 0.01)
... s = np.sin(2 * np.pi * t)
...
... upper = 0.77
... lower = -0.77
...
... supper = np.ma.masked_where(s < upper, s)
... slower = np.ma.masked_where(s > lower, s)
... smiddle = np.ma.masked_where((s < lower) | (s > upper), s)
...
... fig, ax = plt.subplots()
... ax.plot(t, smiddle, t, slower, t, supper)
... plt.show()
...
... #############################################################################
... #
... # .. admonition:: References
... #
... # The use of the following functions, methods, classes and modules is shown
... # in this example:
... #
... # - `matplotlib.axes.Axes.plot` / `matplotlib.pyplot.plot`
...