>>> """
===========================
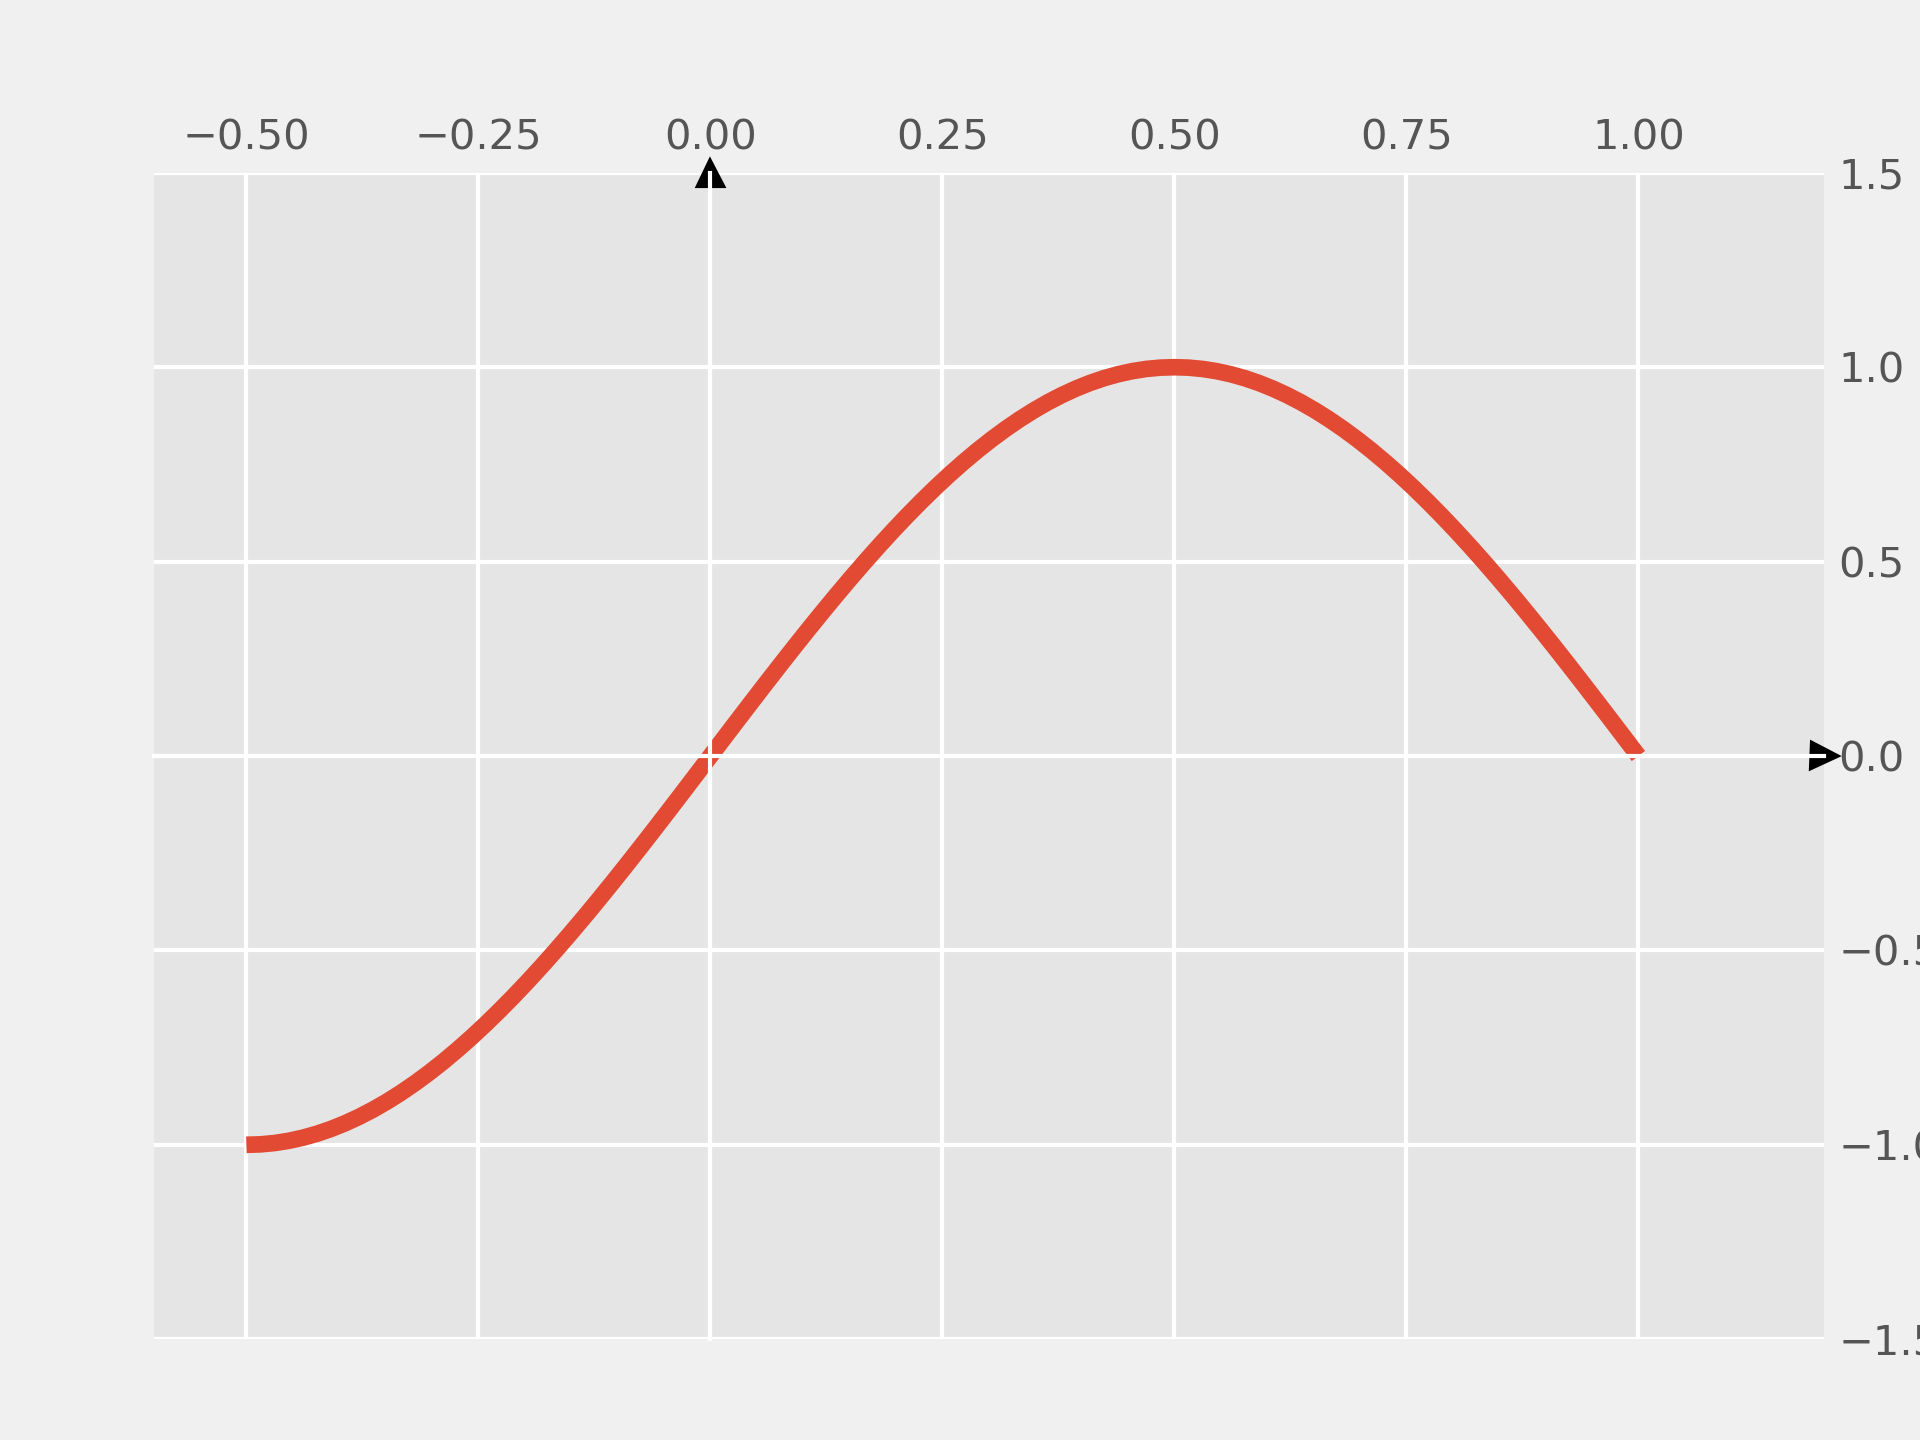
Centered spines with arrows
===========================
This example shows a way to draw a "math textbook" style plot, where the
spines ("axes lines") are drawn at ``x = 0`` and ``y = 0``, and have arrows at
their ends.
"""
...
... import matplotlib.pyplot as plt
... import numpy as np
...
...
... fig, ax = plt.subplots()
... # Move the left and bottom spines to x = 0 and y = 0, respectively.
... ax.spines[["left", "bottom"]].set_position(("data", 0))
... # Hide the top and right spines.
... ax.spines[["top", "right"]].set_visible(False)
...
... # Draw arrows (as black triangles: ">k"/"^k") at the end of the axes. In each
... # case, one of the coordinates (0) is a data coordinate (i.e., y = 0 or x = 0,
... # respectively) and the other one (1) is an axes coordinate (i.e., at the very
... # right/top of the axes). Also, disable clipping (clip_on=False) as the marker
... # actually spills out of the axes.
... ax.plot(1, 0, ">k", transform=ax.get_yaxis_transform(), clip_on=False)
... ax.plot(0, 1, "^k", transform=ax.get_xaxis_transform(), clip_on=False)
...
... # Some sample data.
... x = np.linspace(-0.5, 1., 100)
... ax.plot(x, np.sin(x*np.pi))
...
... plt.show()
...