>>> """
=======
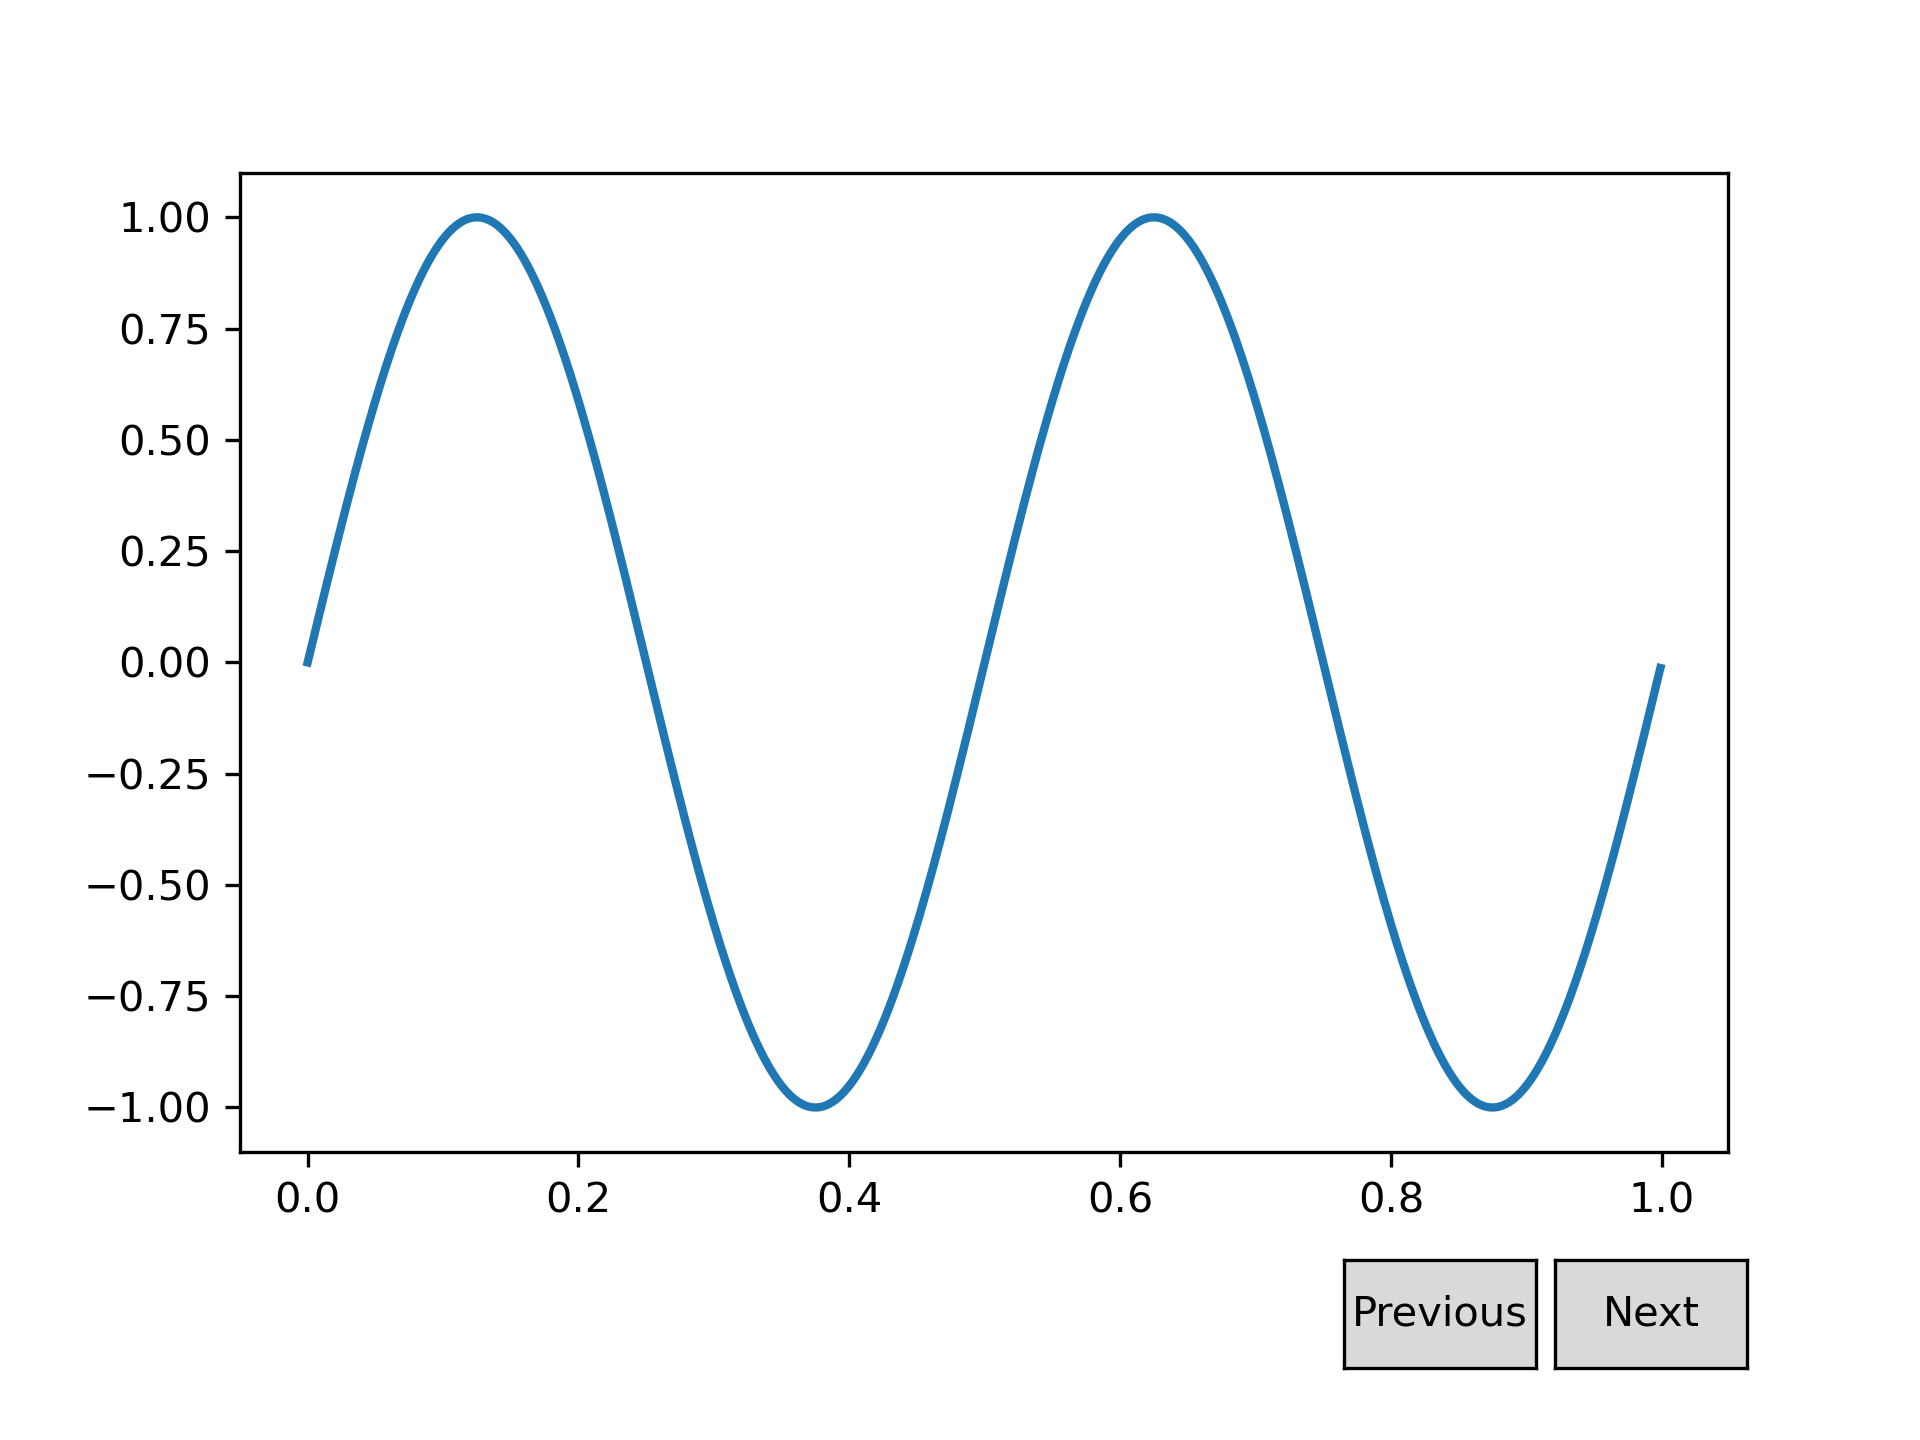
Buttons
=======
Constructing a simple button GUI to modify a sine wave.
The ``next`` and ``previous`` button widget helps visualize the wave with
new frequencies.
"""
...
... import numpy as np
... import matplotlib.pyplot as plt
... from matplotlib.widgets import Button
...
... freqs = np.arange(2, 20, 3)
...
... fig, ax = plt.subplots()
... plt.subplots_adjust(bottom=0.2)
... t = np.arange(0.0, 1.0, 0.001)
... s = np.sin(2*np.pi*freqs[0]*t)
... l, = plt.plot(t, s, lw=2)
...
...
... class Index:
... ind = 0
...
... def next(self, event):
... self.ind += 1
... i = self.ind % len(freqs)
... ydata = np.sin(2*np.pi*freqs[i]*t)
... l.set_ydata(ydata)
... plt.draw()
...
... def prev(self, event):
... self.ind -= 1
... i = self.ind % len(freqs)
... ydata = np.sin(2*np.pi*freqs[i]*t)
... l.set_ydata(ydata)
... plt.draw()
...
... callback = Index()
... axprev = plt.axes([0.7, 0.05, 0.1, 0.075])
... axnext = plt.axes([0.81, 0.05, 0.1, 0.075])
... bnext = Button(axnext, 'Next')
... bnext.on_clicked(callback.next)
... bprev = Button(axprev, 'Previous')
... bprev.on_clicked(callback.prev)
...
... plt.show()
...
... #############################################################################
... #
... # .. admonition:: References
... #
... # The use of the following functions, methods, classes and modules is shown
... # in this example:
... #
... # - `matplotlib.widgets.Button`
...