>>> """
============
Boxplot Demo
============
Example boxplot code
"""
...
... import numpy as np
... import matplotlib.pyplot as plt
...
... # Fixing random state for reproducibility
... np.random.seed(19680801)
...
... # fake up some data
... spread = np.random.rand(50) * 100
... center = np.ones(25) * 50
... flier_high = np.random.rand(10) * 100 + 100
... flier_low = np.random.rand(10) * -100
... data = np.concatenate((spread, center, flier_high, flier_low))
...
... ###############################################################################
...
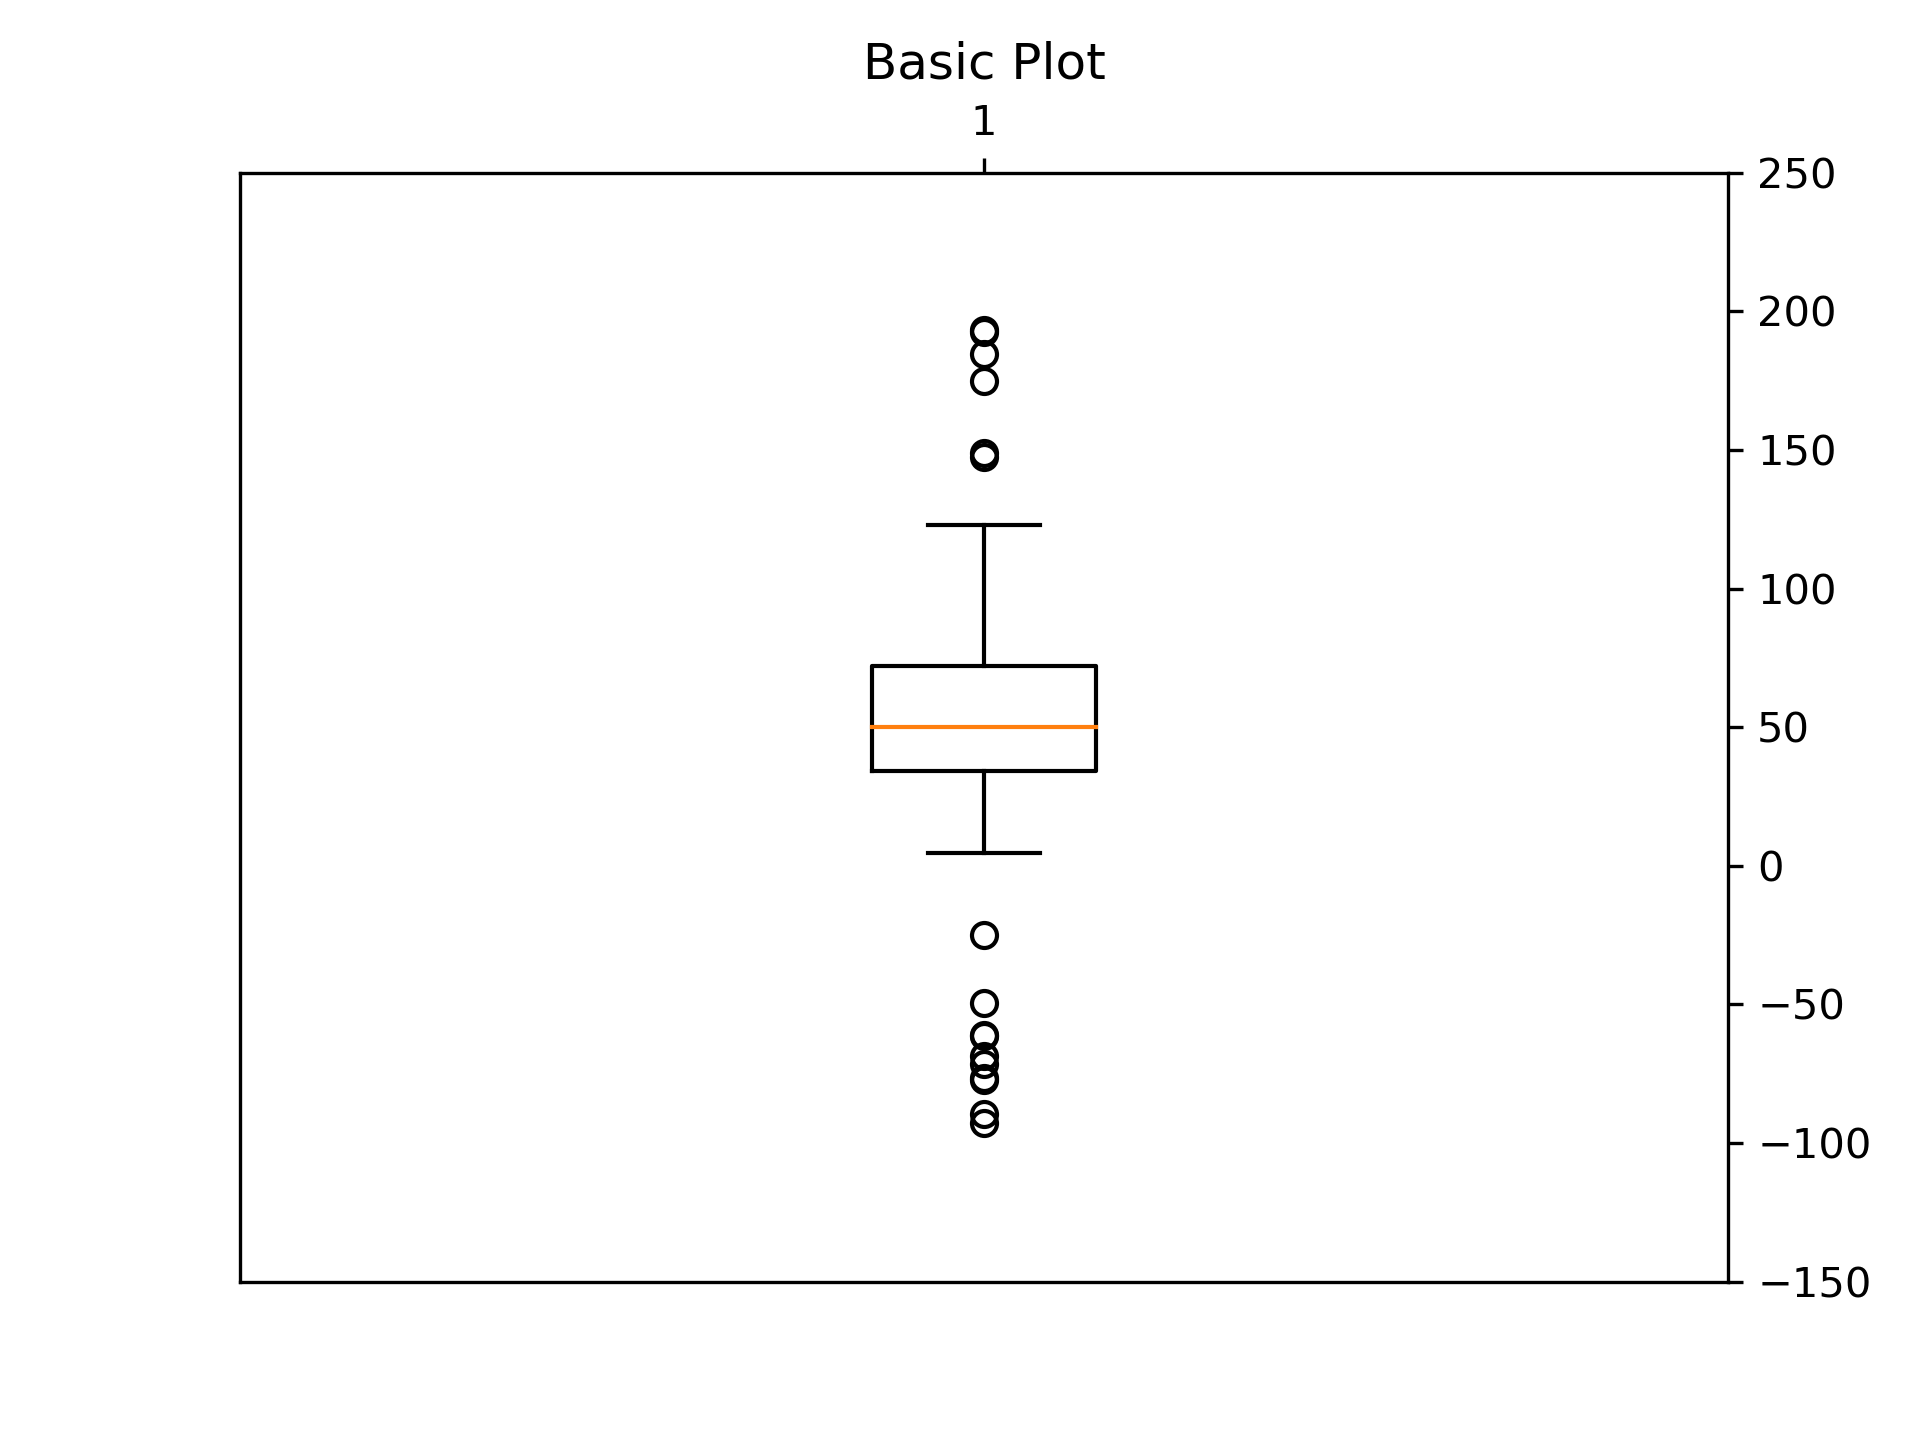
... fig1, ax1 = plt.subplots()
... ax1.set_title('Basic Plot')
... ax1.boxplot(data)
...
... ###############################################################################
...
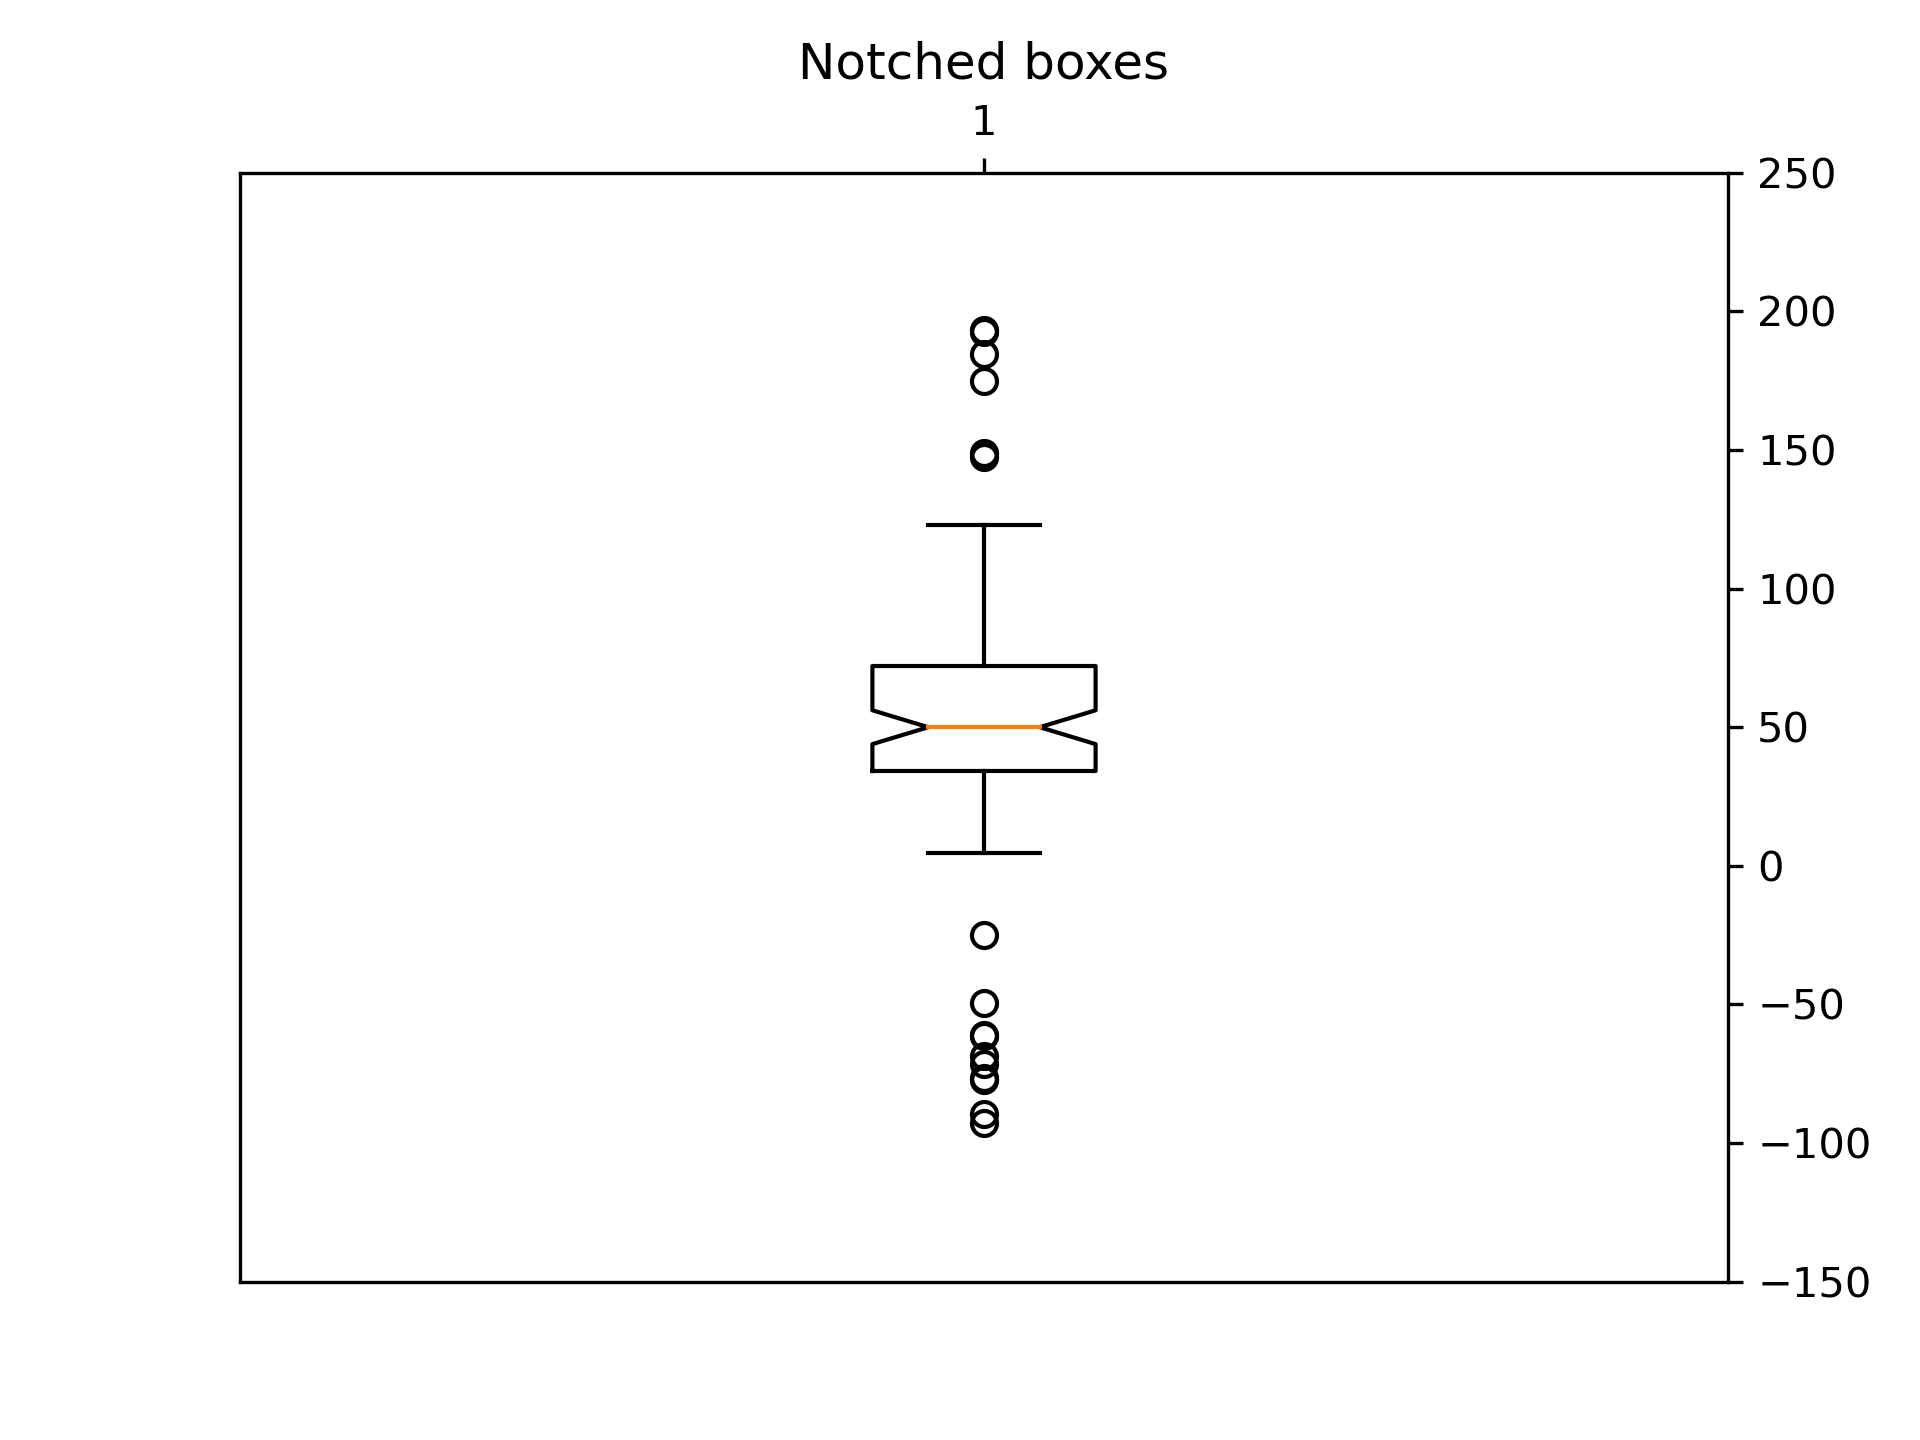
... fig2, ax2 = plt.subplots()
... ax2.set_title('Notched boxes')
... ax2.boxplot(data, notch=True)
...
... ###############################################################################
...
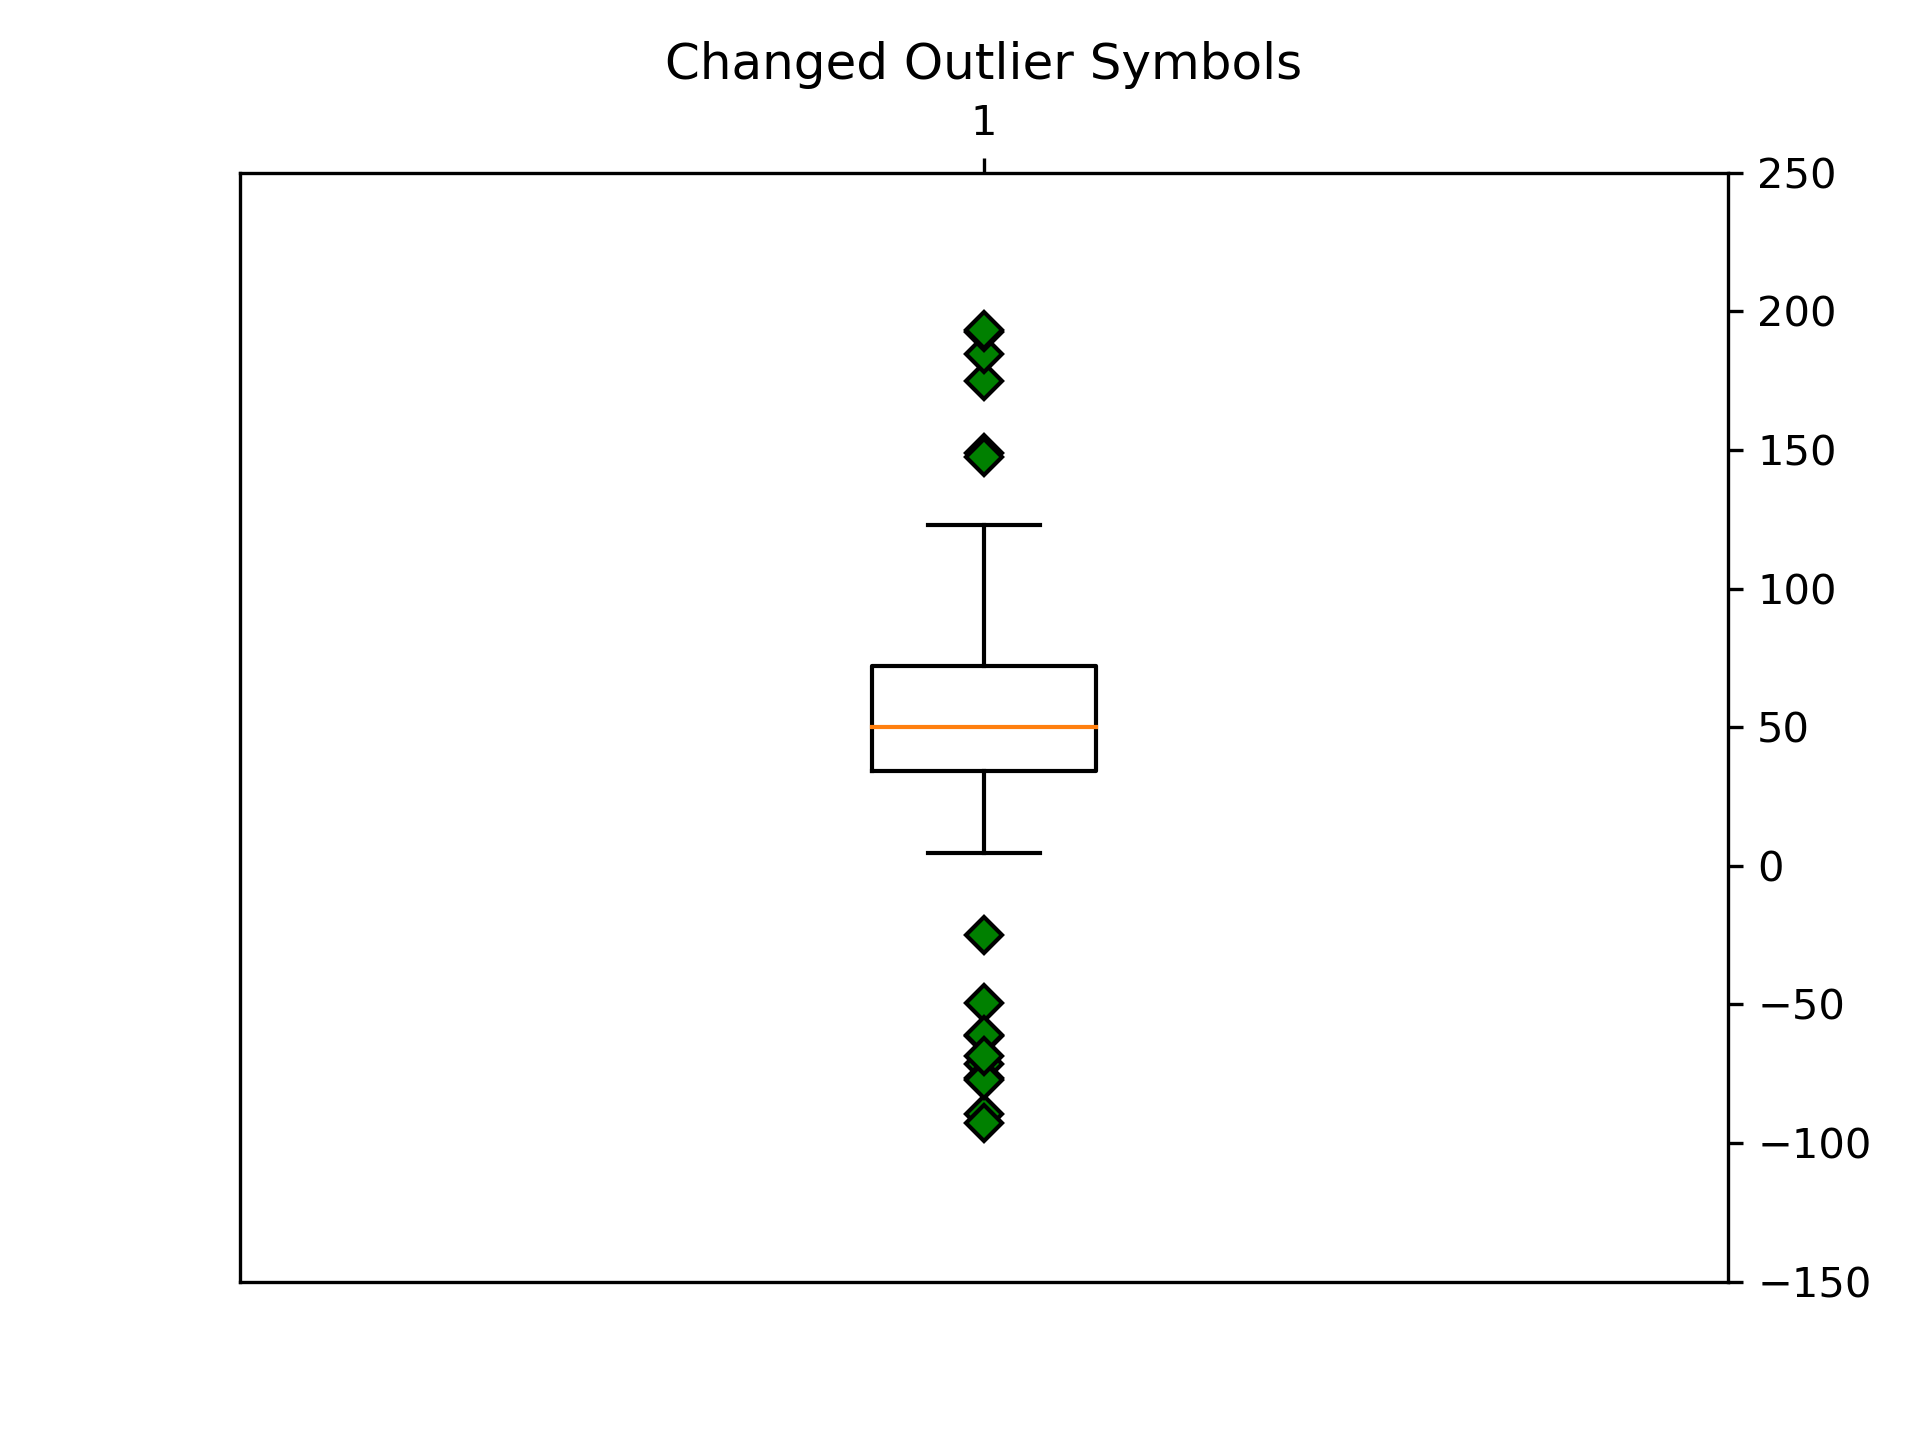
... green_diamond = dict(markerfacecolor='g', marker='D')
... fig3, ax3 = plt.subplots()
... ax3.set_title('Changed Outlier Symbols')
... ax3.boxplot(data, flierprops=green_diamond)
...
... ###############################################################################
...
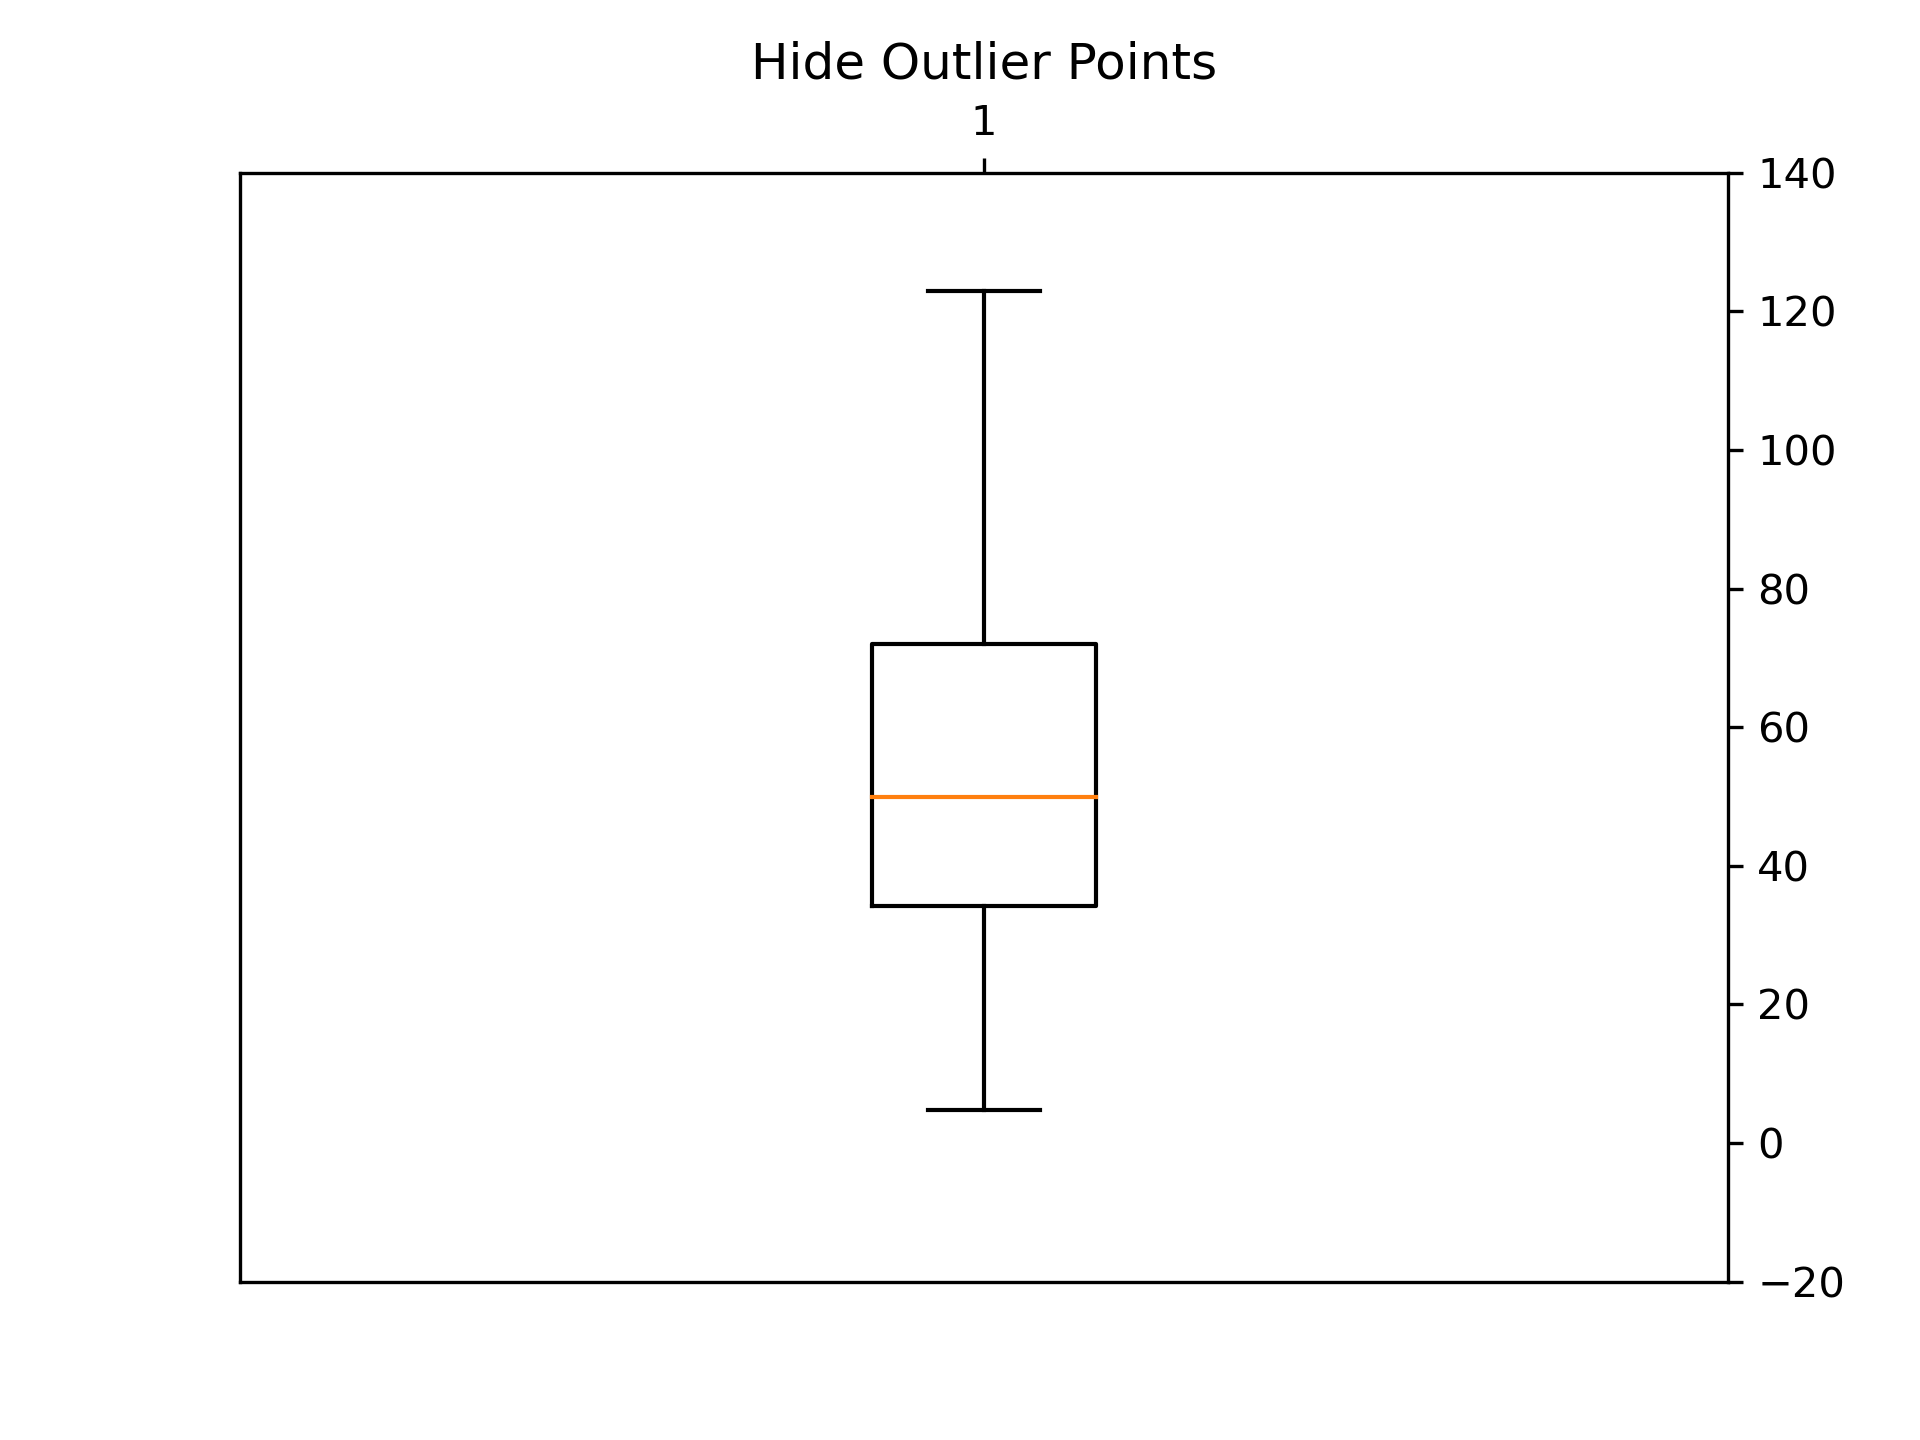
... fig4, ax4 = plt.subplots()
... ax4.set_title('Hide Outlier Points')
... ax4.boxplot(data, showfliers=False)
...
... ###############################################################################
...
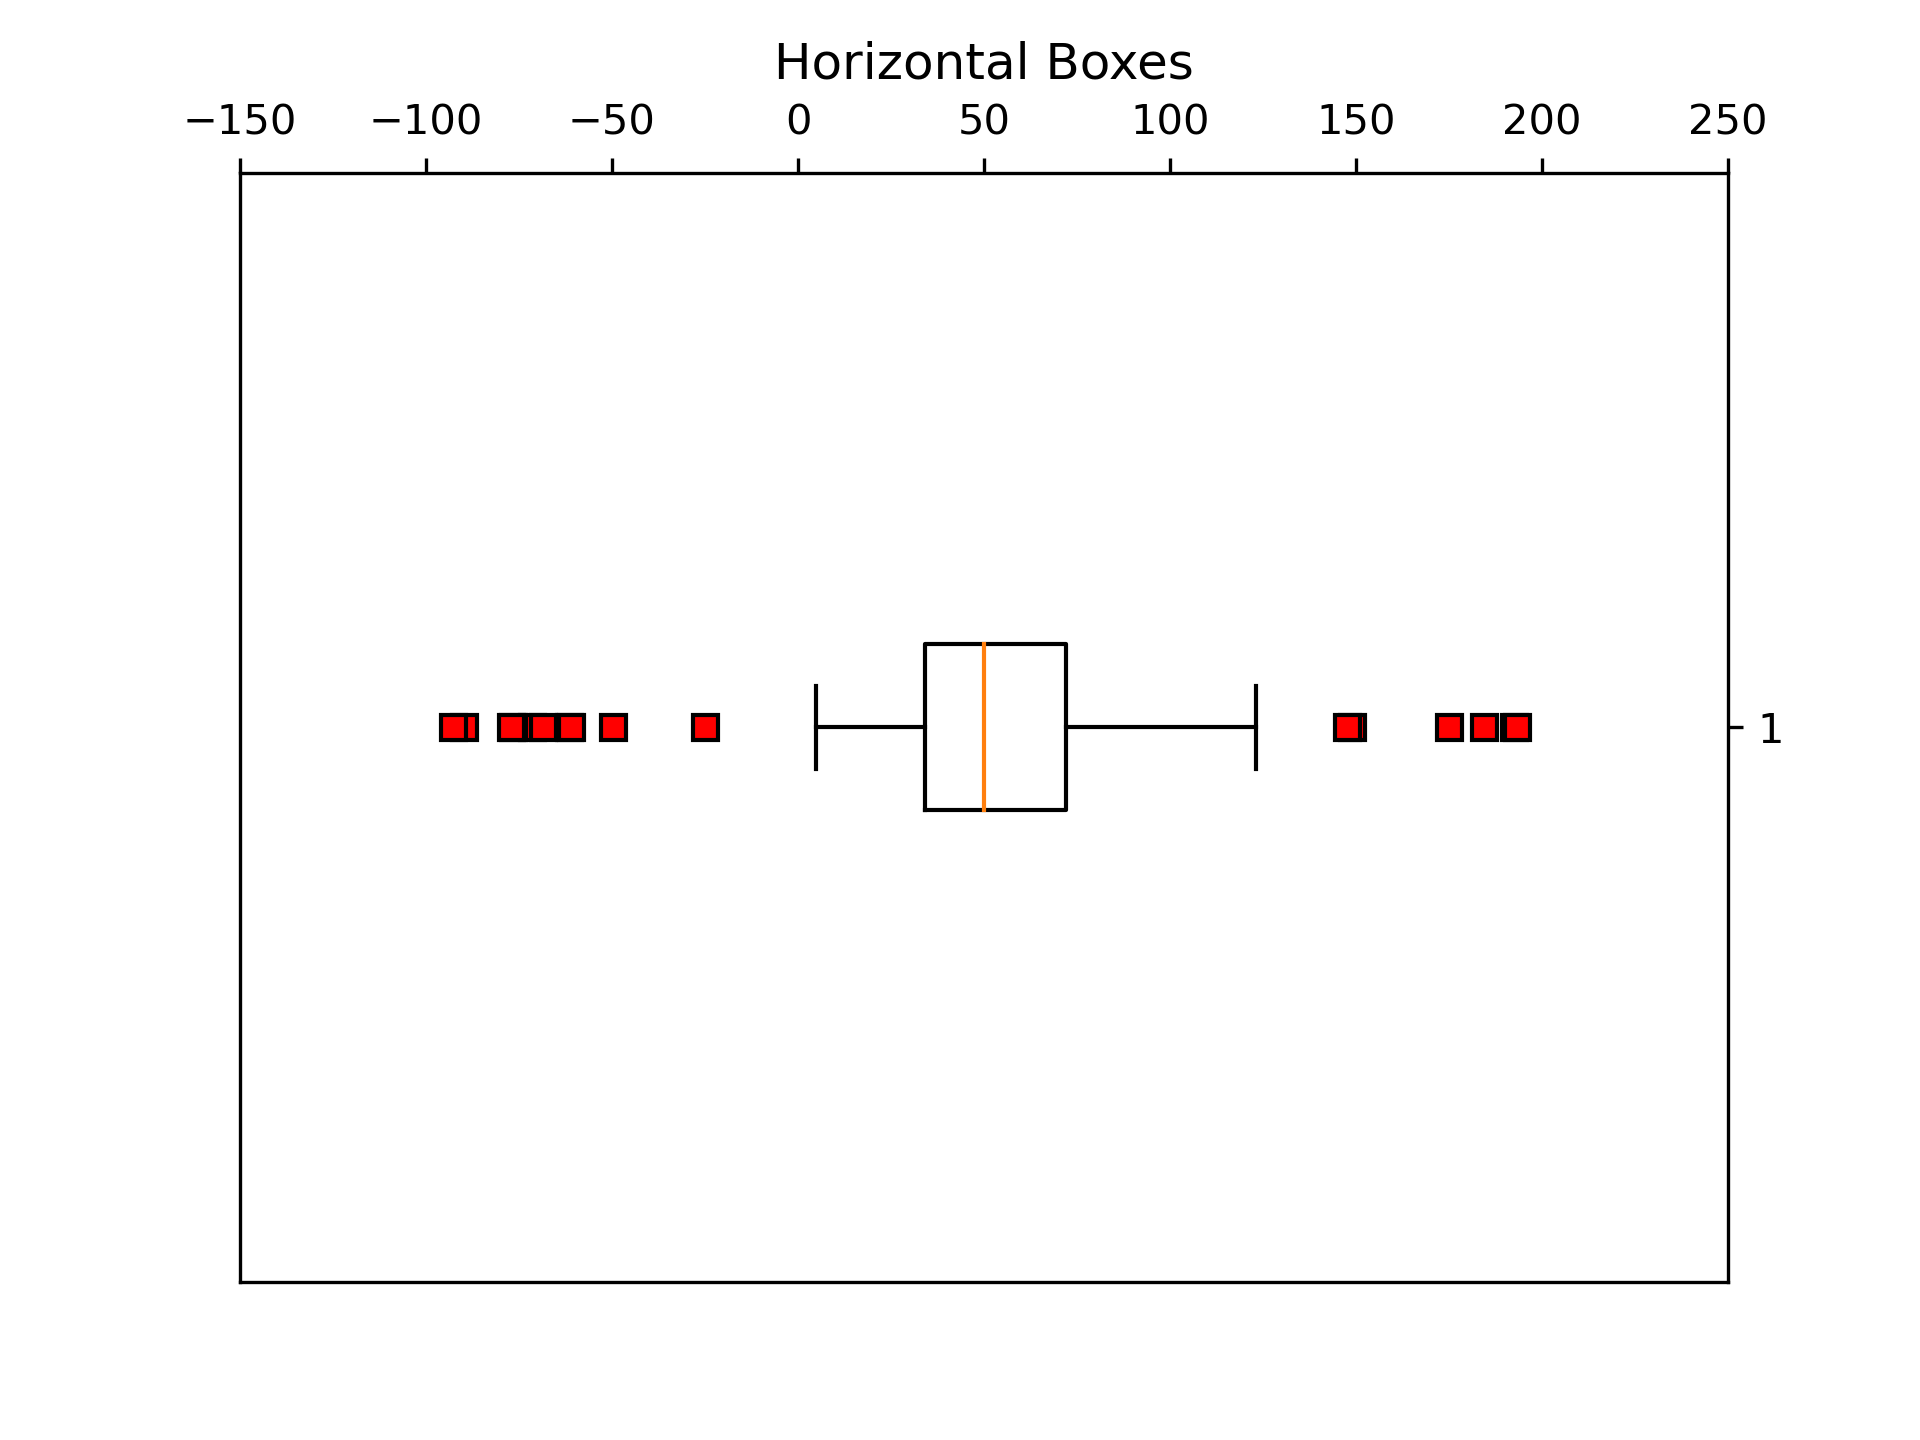
... red_square = dict(markerfacecolor='r', marker='s')
... fig5, ax5 = plt.subplots()
... ax5.set_title('Horizontal Boxes')
... ax5.boxplot(data, vert=False, flierprops=red_square)
...
... ###############################################################################
...
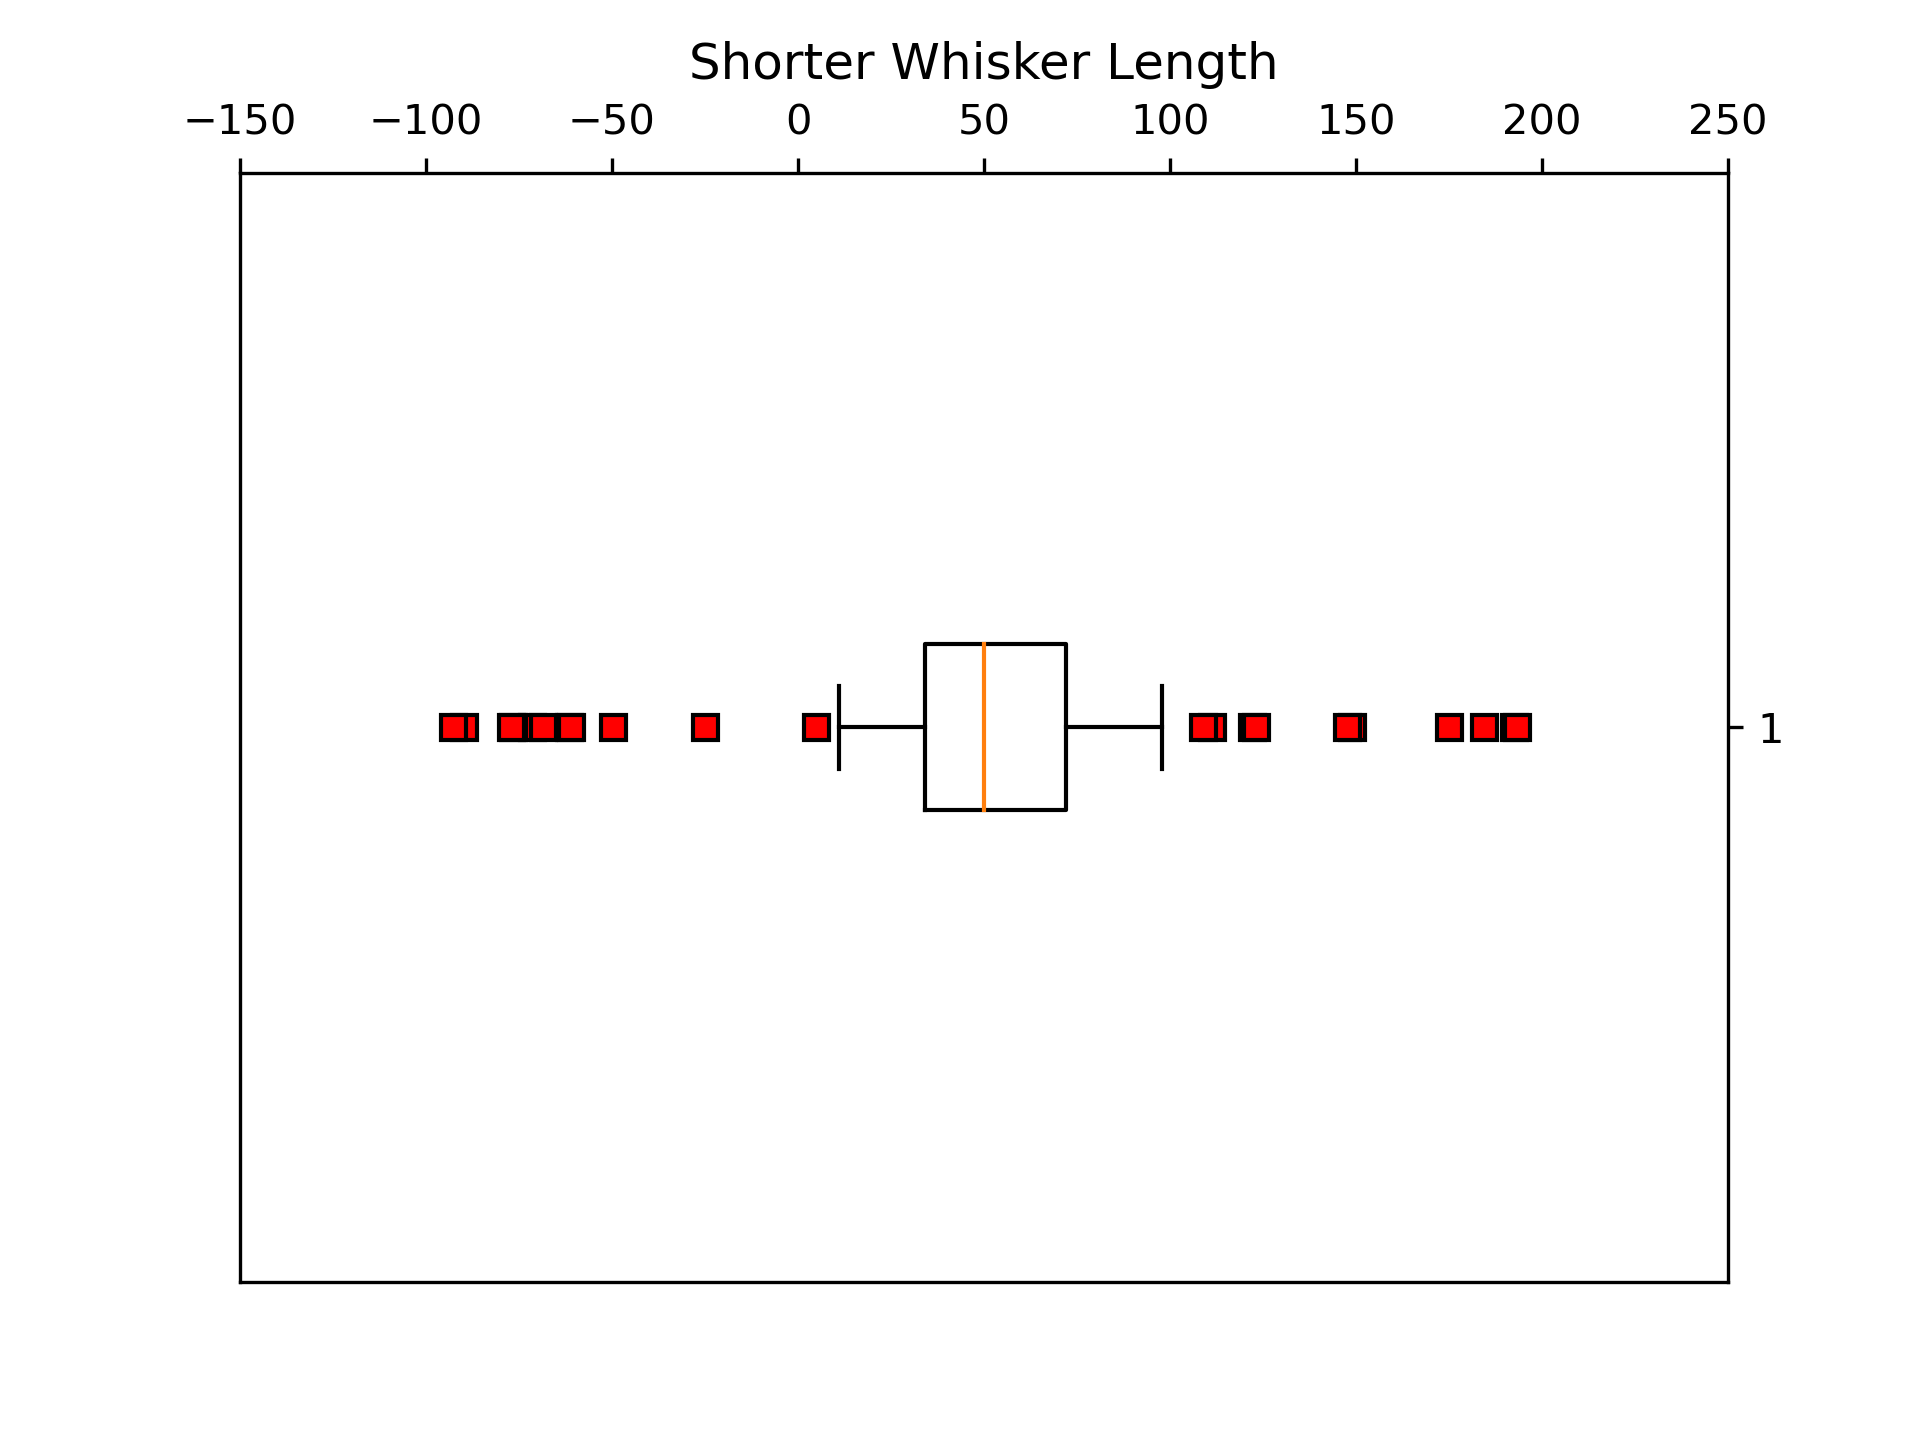
... fig6, ax6 = plt.subplots()
... ax6.set_title('Shorter Whisker Length')
... ax6.boxplot(data, flierprops=red_square, vert=False, whis=0.75)
...
... ###############################################################################
... # Fake up some more data
...
... spread = np.random.rand(50) * 100
... center = np.ones(25) * 40
... flier_high = np.random.rand(10) * 100 + 100
... flier_low = np.random.rand(10) * -100
... d2 = np.concatenate((spread, center, flier_high, flier_low))
...
... ###############################################################################
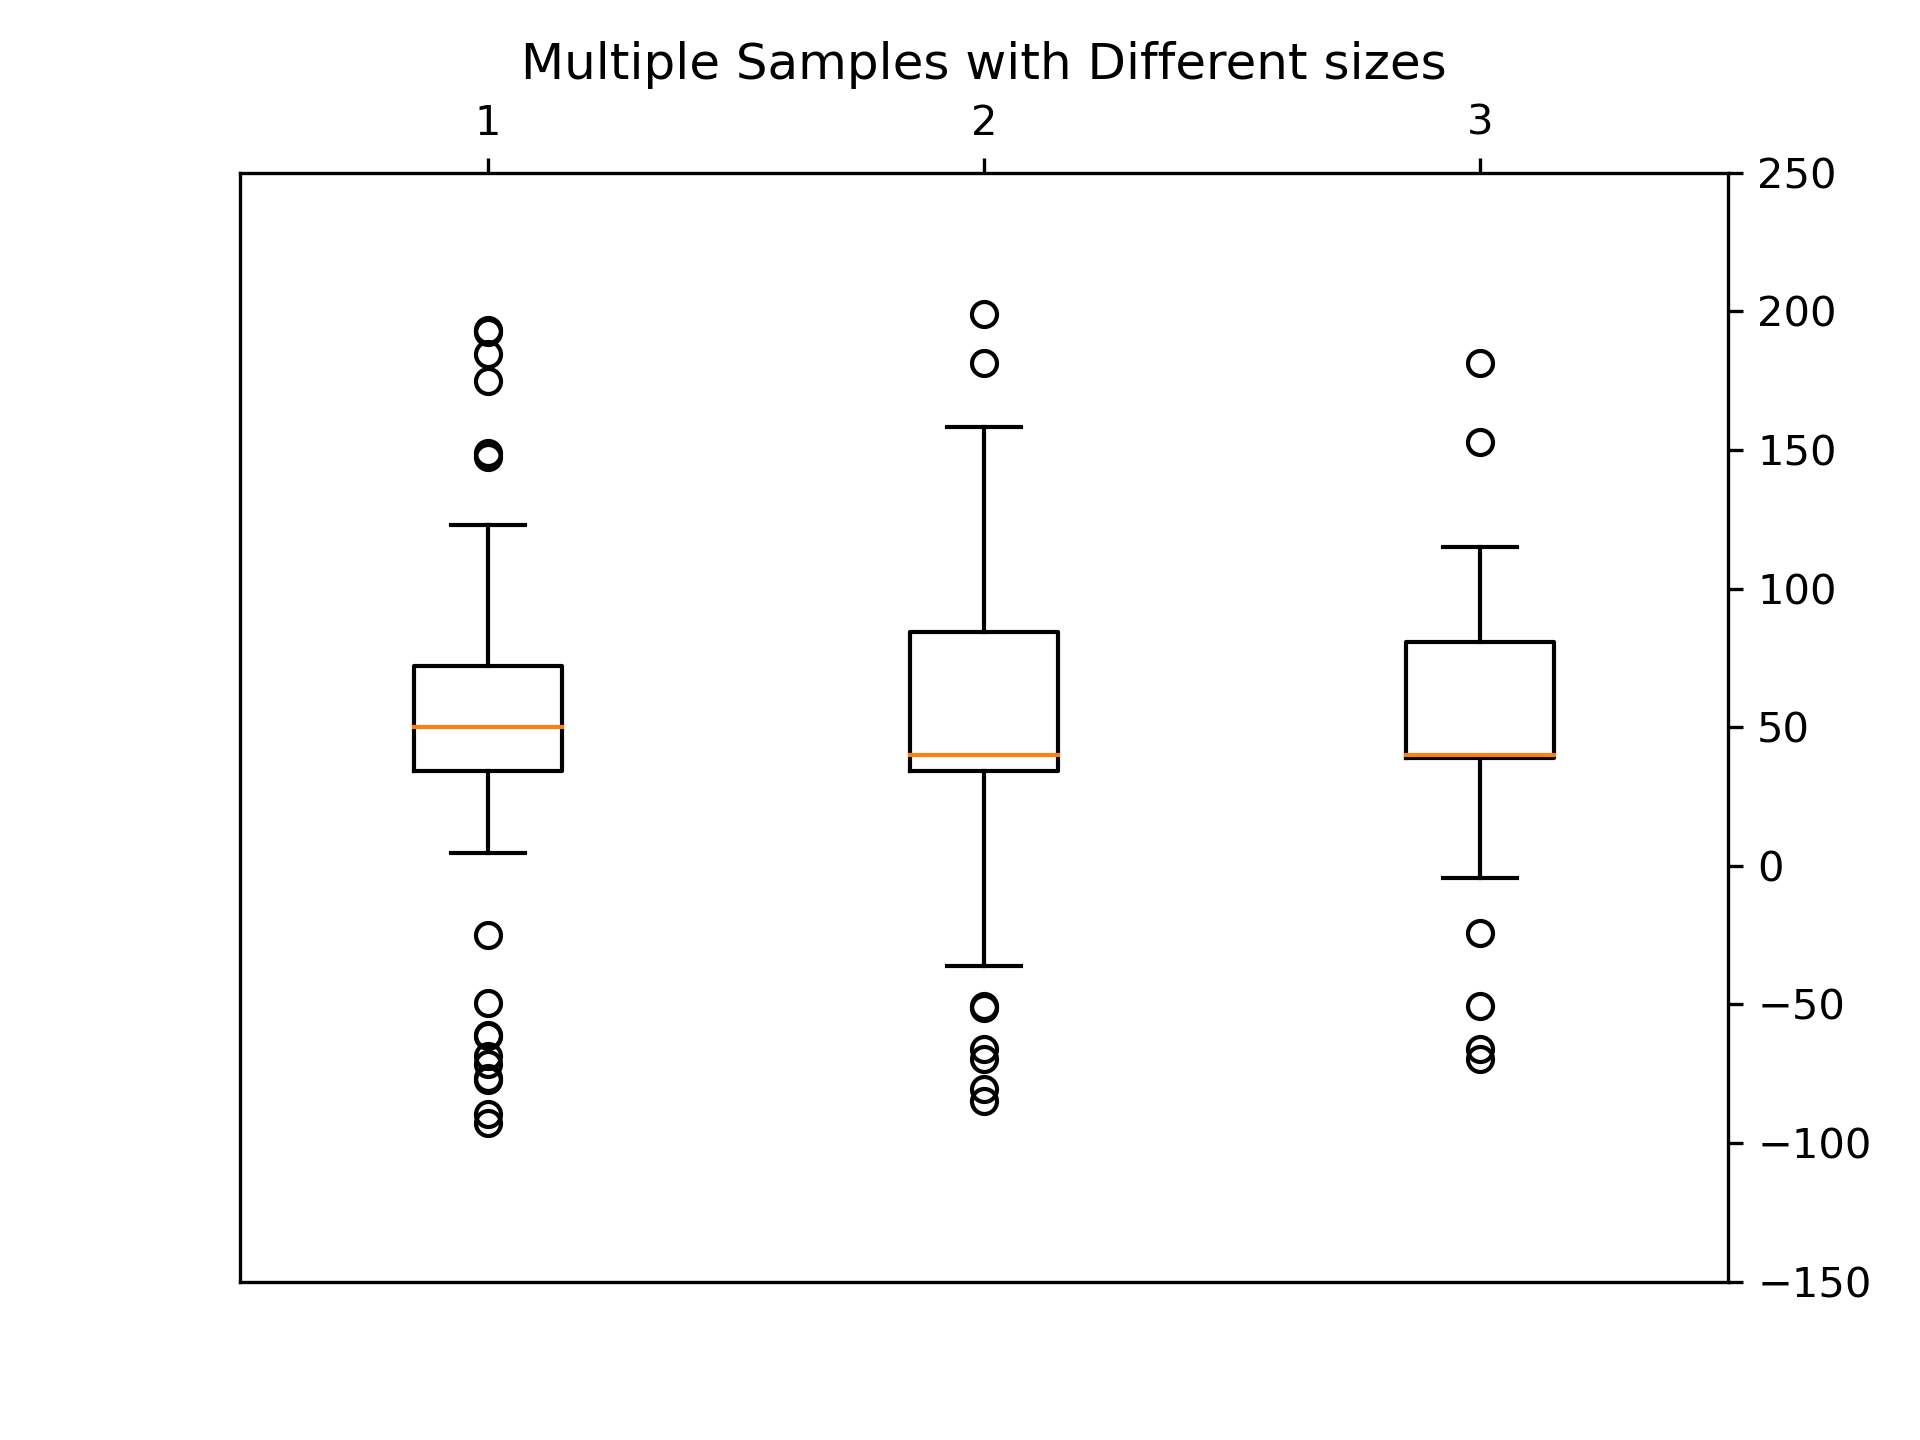
... # Making a 2-D array only works if all the columns are the
... # same length. If they are not, then use a list instead.
... # This is actually more efficient because boxplot converts
... # a 2-D array into a list of vectors internally anyway.
...
... data = [data, d2, d2[::2]]
... fig7, ax7 = plt.subplots()
... ax7.set_title('Multiple Samples with Different sizes')
... ax7.boxplot(data)
...
... plt.show()
...
... #############################################################################
... #
... # .. admonition:: References
... #
... # The use of the following functions, methods, classes and modules is shown
... # in this example:
... #
... # - `matplotlib.axes.Axes.boxplot` / `matplotlib.pyplot.boxplot`
...