>>> """
=================================
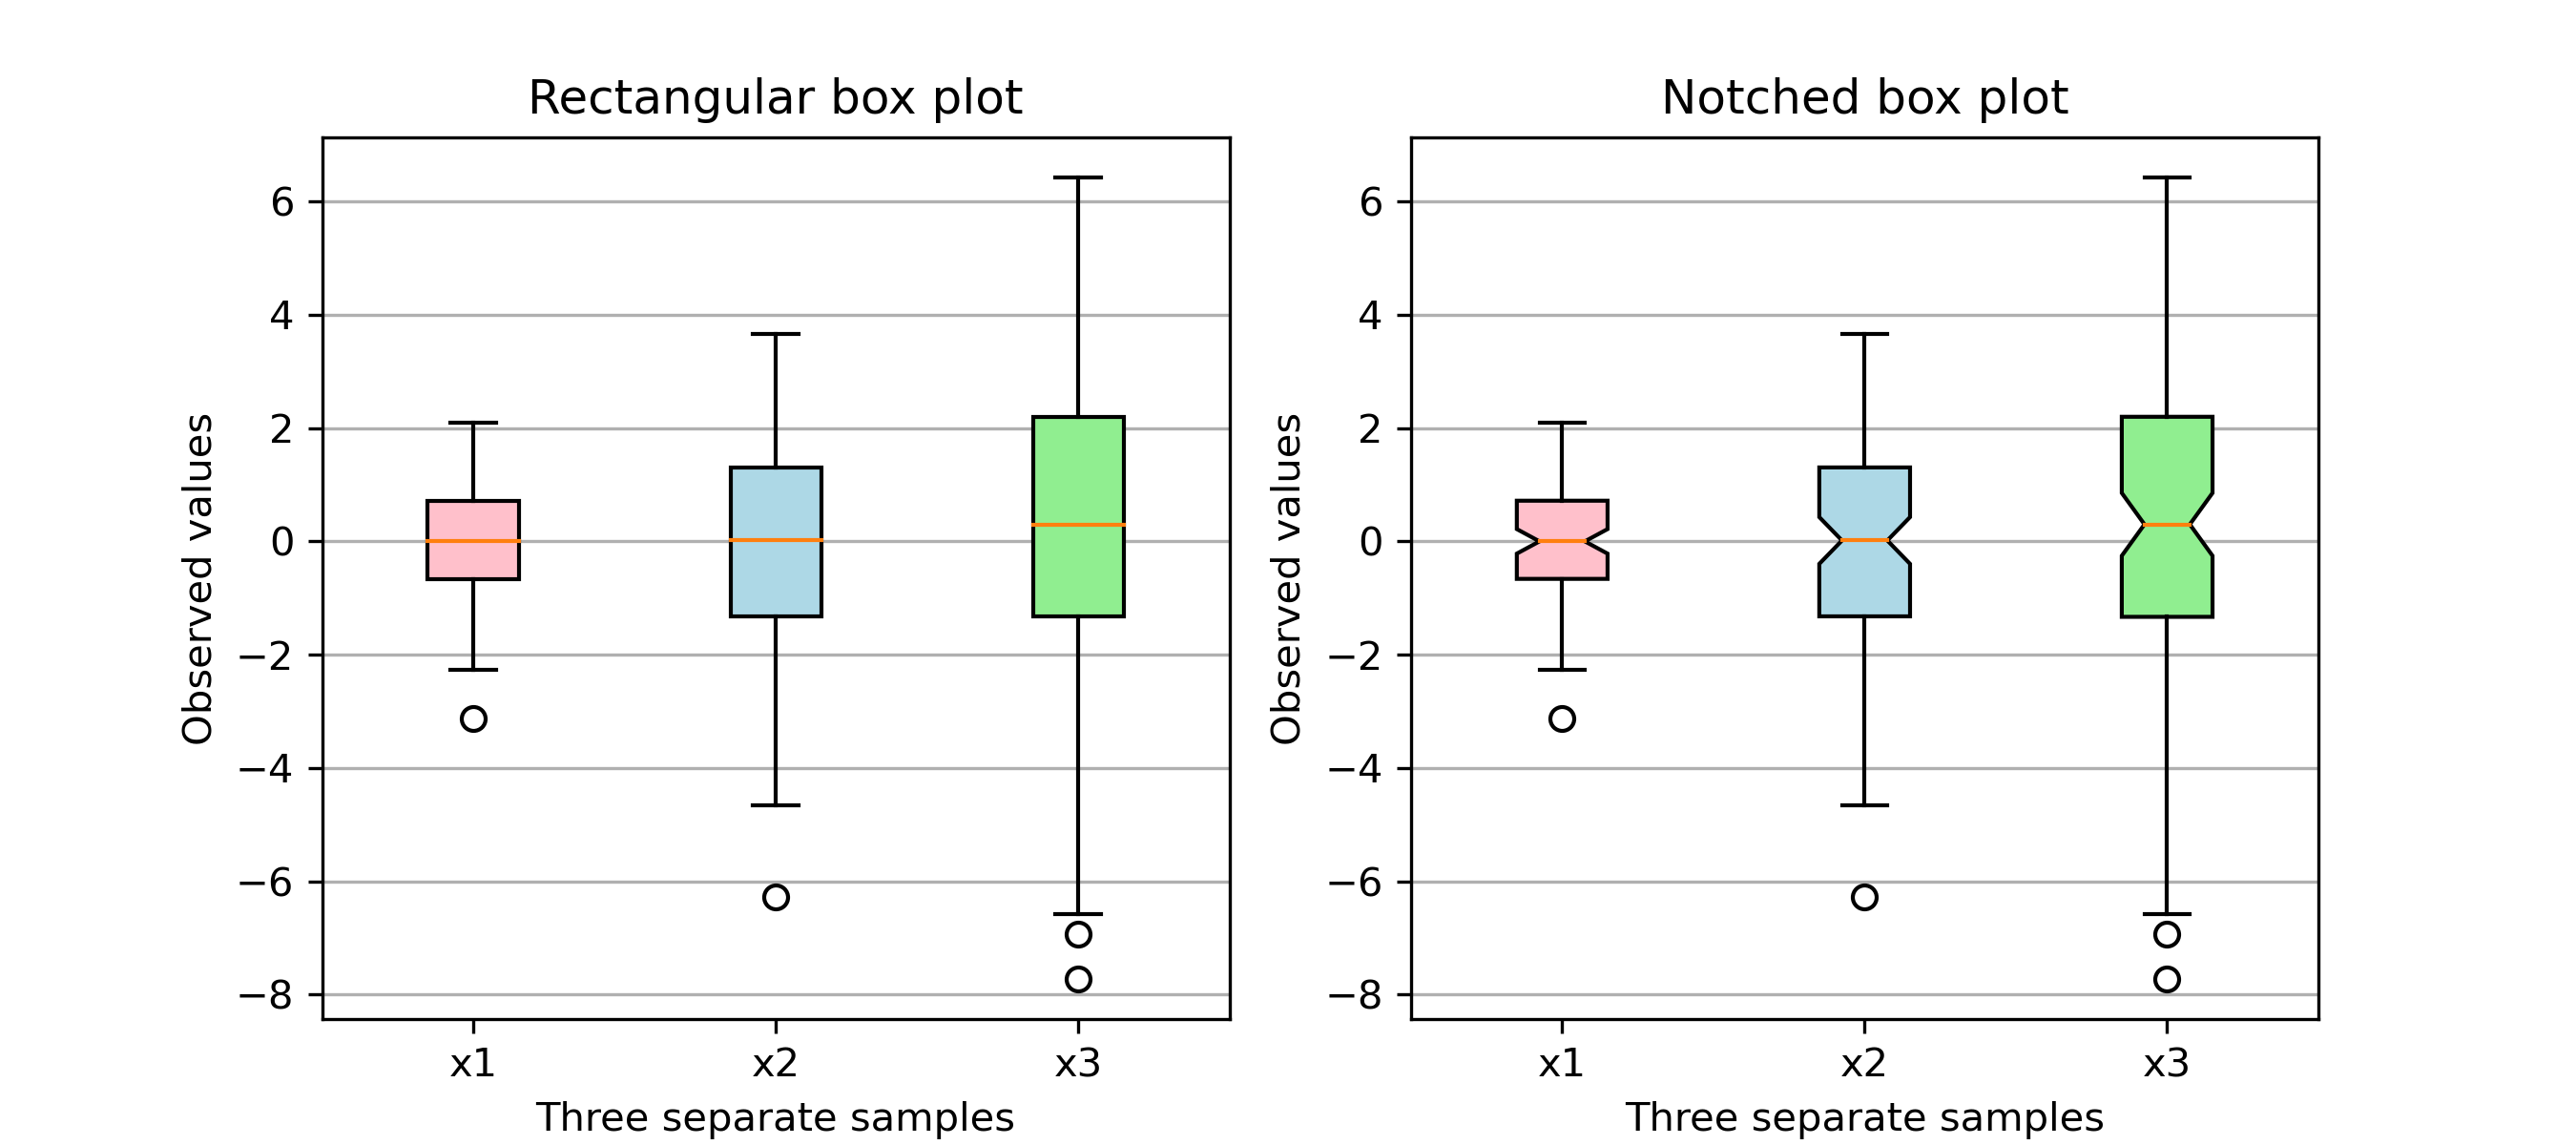
Box plots with custom fill colors
=================================
This plot illustrates how to create two types of box plots
(rectangular and notched), and how to fill them with custom
colors by accessing the properties of the artists of the
box plots. Additionally, the ``labels`` parameter is used to
provide x-tick labels for each sample.
A good general reference on boxplots and their history can be found
here: http://vita.had.co.nz/papers/boxplots.pdf
"""
...
... import matplotlib.pyplot as plt
... import numpy as np
...
... # Random test data
... np.random.seed(19680801)
... all_data = [np.random.normal(0, std, size=100) for std in range(1, 4)]
... labels = ['x1', 'x2', 'x3']
...
... fig, (ax1, ax2) = plt.subplots(nrows=1, ncols=2, figsize=(9, 4))
...
... # rectangular box plot
... bplot1 = ax1.boxplot(all_data,
... vert=True, # vertical box alignment
... patch_artist=True, # fill with color
... labels=labels) # will be used to label x-ticks
... ax1.set_title('Rectangular box plot')
...
... # notch shape box plot
... bplot2 = ax2.boxplot(all_data,
... notch=True, # notch shape
... vert=True, # vertical box alignment
... patch_artist=True, # fill with color
... labels=labels) # will be used to label x-ticks
... ax2.set_title('Notched box plot')
...
... # fill with colors
... colors = ['pink', 'lightblue', 'lightgreen']
... for bplot in (bplot1, bplot2):
... for patch, color in zip(bplot['boxes'], colors):
... patch.set_facecolor(color)
...
... # adding horizontal grid lines
... for ax in [ax1, ax2]:
... ax.yaxis.grid(True)
... ax.set_xlabel('Three separate samples')
... ax.set_ylabel('Observed values')
...
... plt.show()
...
... #############################################################################
... #
... # .. admonition:: References
... #
... # The use of the following functions, methods, classes and modules is shown
... # in this example:
... #
... # - `matplotlib.axes.Axes.boxplot` / `matplotlib.pyplot.boxplot`
...