>>> """
===================
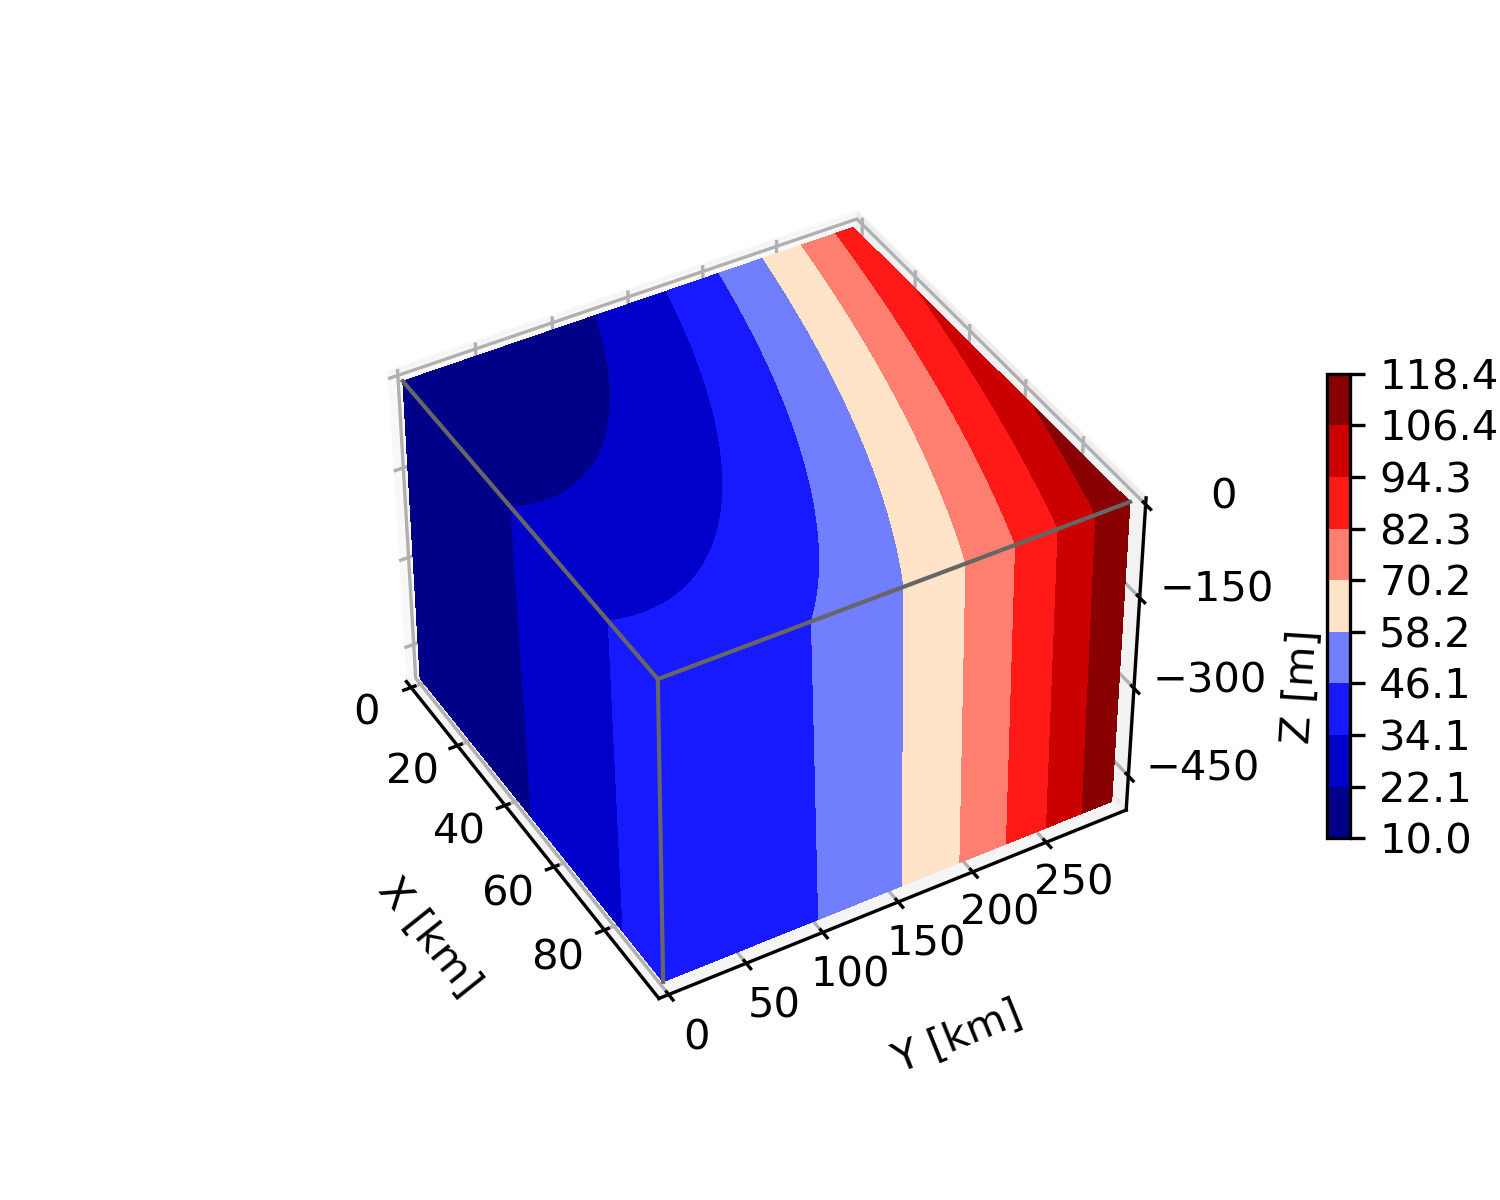
3D box surface plot
===================
Given data on a gridded volume ``X``, ``Y``, ``Z``, this example plots the
data values on the volume surfaces.
The strategy is to select the data from each surface and plot
contours separately using `.axes3d.Axes3D.contourf` with appropriate
parameters *zdir* and *offset*.
"""
...
... import matplotlib.pyplot as plt
... import numpy as np
...
... # Define dimensions
... Nx, Ny, Nz = 100, 300, 500
... X, Y, Z = np.meshgrid(np.arange(Nx), np.arange(Ny), -np.arange(Nz))
...
... # Create fake data
... data = (((X+100)**2 + (Y-20)**2 + 2*Z)/1000+1)
...
... kw = {
... 'vmin': data.min(),
... 'vmax': data.max(),
... 'levels': np.linspace(data.min(), data.max(), 10),
... }
...
... # Create a figure with 3D ax
... fig = plt.figure(figsize=(5, 4))
... ax = fig.add_subplot(111, projection='3d')
...
... # Plot contour surfaces
... _ = ax.contourf(
... X[:, :, 0], Y[:, :, 0], data[:, :, 0],
... zdir='z', offset=0, **kw
... )
... _ = ax.contourf(
... X[0, :, :], data[0, :, :], Z[0, :, :],
... zdir='y', offset=0, **kw
... )
... C = ax.contourf(
... data[:, -1, :], Y[:, -1, :], Z[:, -1, :],
... zdir='x', offset=X.max(), **kw
... )
... # --
...
...
... # Set limits of the plot from coord limits
... xmin, xmax = X.min(), X.max()
... ymin, ymax = Y.min(), Y.max()
... zmin, zmax = Z.min(), Z.max()
... ax.set(xlim=[xmin, xmax], ylim=[ymin, ymax], zlim=[zmin, zmax])
...
... # Plot edges
... edges_kw = dict(color='0.4', linewidth=1, zorder=1e3)
... ax.plot([xmax, xmax], [ymin, ymax], 0, **edges_kw)
... ax.plot([xmin, xmax], [ymin, ymin], 0, **edges_kw)
... ax.plot([xmax, xmax], [ymin, ymin], [zmin, zmax], **edges_kw)
...
... # Set labels and zticks
... ax.set(
... xlabel='X [km]',
... ylabel='Y [km]',
... zlabel='Z [m]',
... zticks=[0, -150, -300, -450],
... )
...
... # Set distance and angle view
... ax.view_init(40, -30)
... ax.dist = 11
...
... # Colorbar
... fig.colorbar(C, ax=ax, fraction=0.02, pad=0.1, label='Name [units]')
...
... # Show Figure
... plt.show()
...