>>> """
===========================================
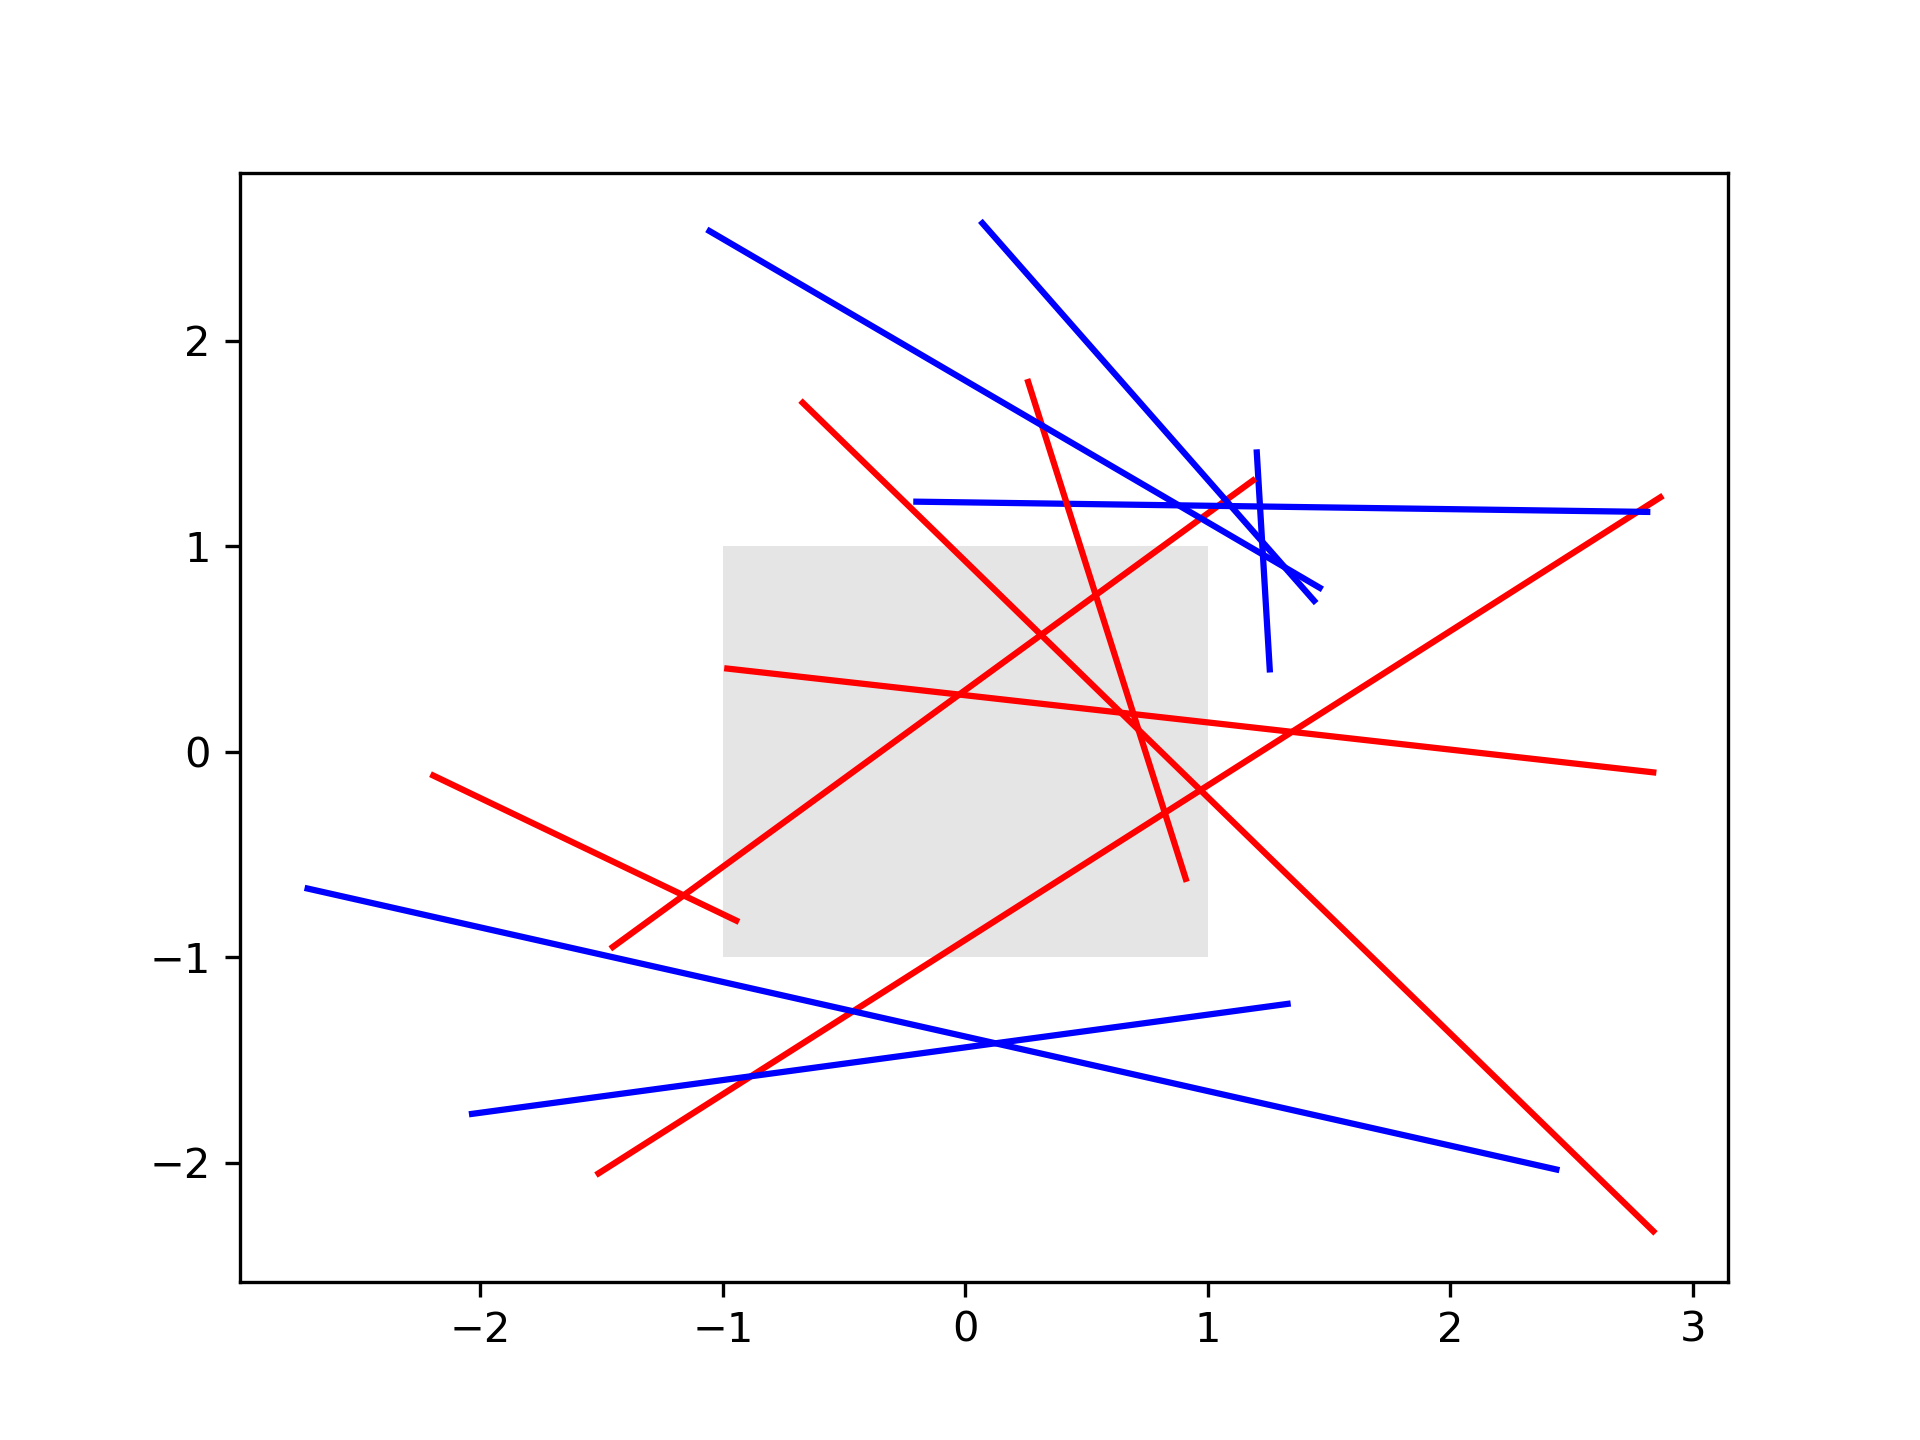
Changing colors of lines intersecting a box
===========================================
The lines intersecting the rectangle are colored in red, while the others
are left as blue lines. This example showcases the `.intersects_bbox` function.
"""
...
... import numpy as np
... import matplotlib.pyplot as plt
... from matplotlib.transforms import Bbox
... from matplotlib.path import Path
...
... # Fixing random state for reproducibility
... np.random.seed(19680801)
...
...
... left, bottom, width, height = (-1, -1, 2, 2)
... rect = plt.Rectangle((left, bottom), width, height,
... facecolor="black", alpha=0.1)
...
... fig, ax = plt.subplots()
... ax.add_patch(rect)
...
... bbox = Bbox.from_bounds(left, bottom, width, height)
...
... for i in range(12):
... vertices = (np.random.random((2, 2)) - 0.5) * 6.0
... path = Path(vertices)
... if path.intersects_bbox(bbox):
... color = 'r'
... else:
... color = 'b'
... ax.plot(vertices[:, 0], vertices[:, 1], color=color)
...
... plt.show()
...