>>> """
========================================
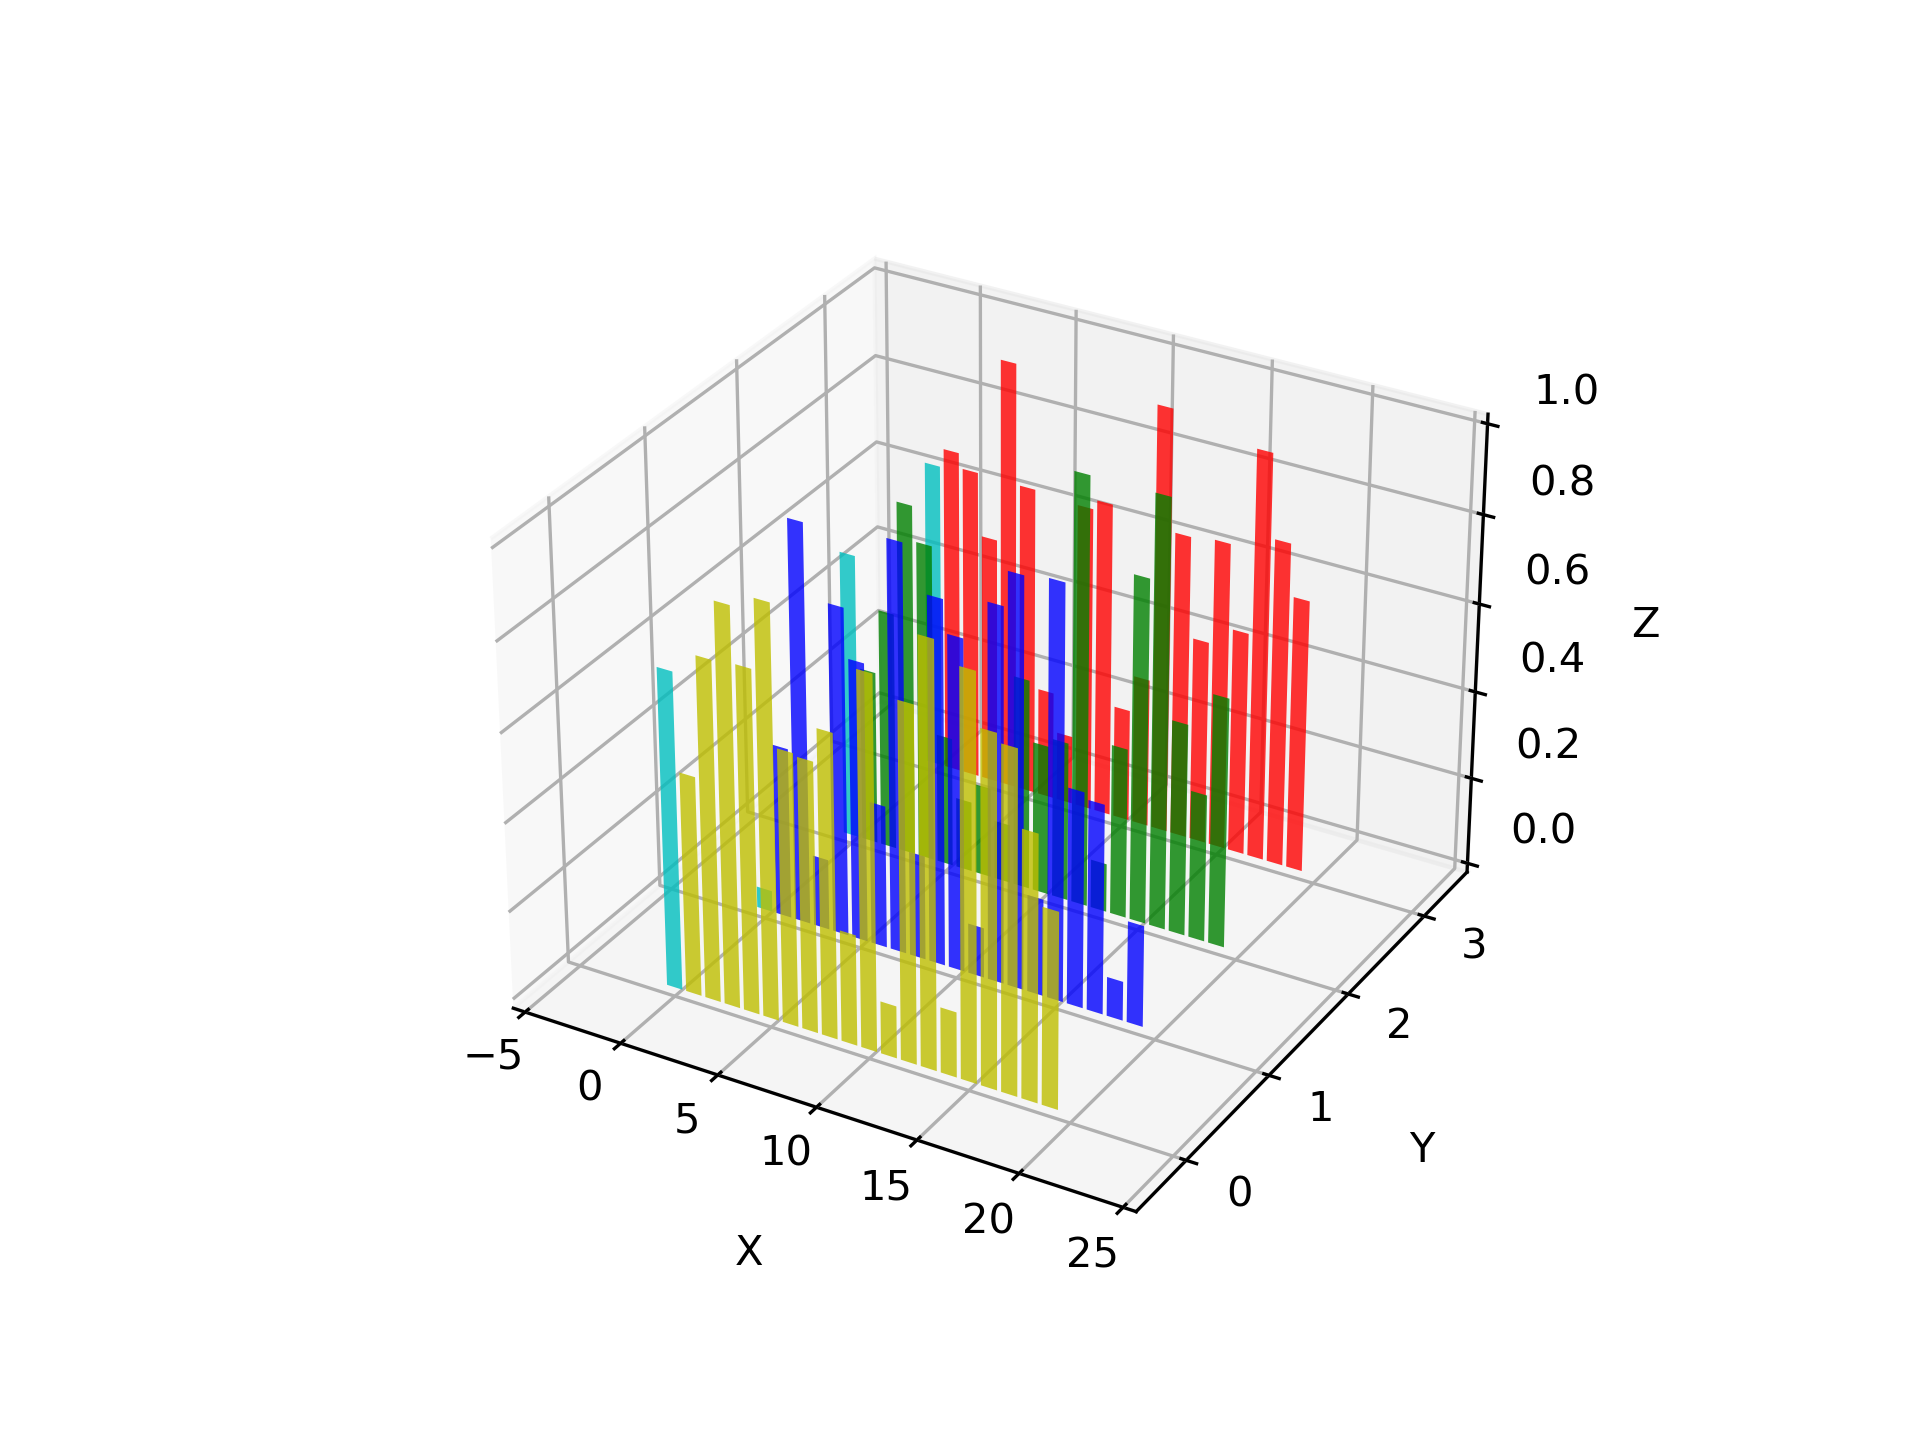
Create 2D bar graphs in different planes
========================================
Demonstrates making a 3D plot which has 2D bar graphs projected onto
planes y=0, y=1, etc.
"""
...
... import matplotlib.pyplot as plt
... import numpy as np
...
... # Fixing random state for reproducibility
... np.random.seed(19680801)
...
...
... fig = plt.figure()
... ax = fig.add_subplot(projection='3d')
...
... colors = ['r', 'g', 'b', 'y']
... yticks = [3, 2, 1, 0]
... for c, k in zip(colors, yticks):
... # Generate the random data for the y=k 'layer'.
... xs = np.arange(20)
... ys = np.random.rand(20)
...
... # You can provide either a single color or an array with the same length as
... # xs and ys. To demonstrate this, we color the first bar of each set cyan.
... cs = [c] * len(xs)
... cs[0] = 'c'
...
... # Plot the bar graph given by xs and ys on the plane y=k with 80% opacity.
... ax.bar(xs, ys, zs=k, zdir='y', color=cs, alpha=0.8)
...
... ax.set_xlabel('X')
... ax.set_ylabel('Y')
... ax.set_zlabel('Z')
...
... # On the y axis let's only label the discrete values that we have data for.
... ax.set_yticks(yticks)
...
... plt.show()
...