>>> """
==============
Bar Label Demo
==============
This example shows how to use the `~.Axes.bar_label` helper function
to create bar chart labels.
See also the :doc:`grouped bar
</gallery/lines_bars_and_markers/barchart>`,
:doc:`stacked bar
</gallery/lines_bars_and_markers/bar_stacked>` and
:doc:`horizontal bar chart
</gallery/lines_bars_and_markers/barh>` examples.
"""
...
... import matplotlib.pyplot as plt
... import numpy as np
...
... ###############################################################################
... # Define the data
...
... N = 5
... menMeans = (20, 35, 30, 35, -27)
... womenMeans = (25, 32, 34, 20, -25)
... menStd = (2, 3, 4, 1, 2)
... womenStd = (3, 5, 2, 3, 3)
... ind = np.arange(N) # the x locations for the groups
... width = 0.35 # the width of the bars: can also be len(x) sequence
...
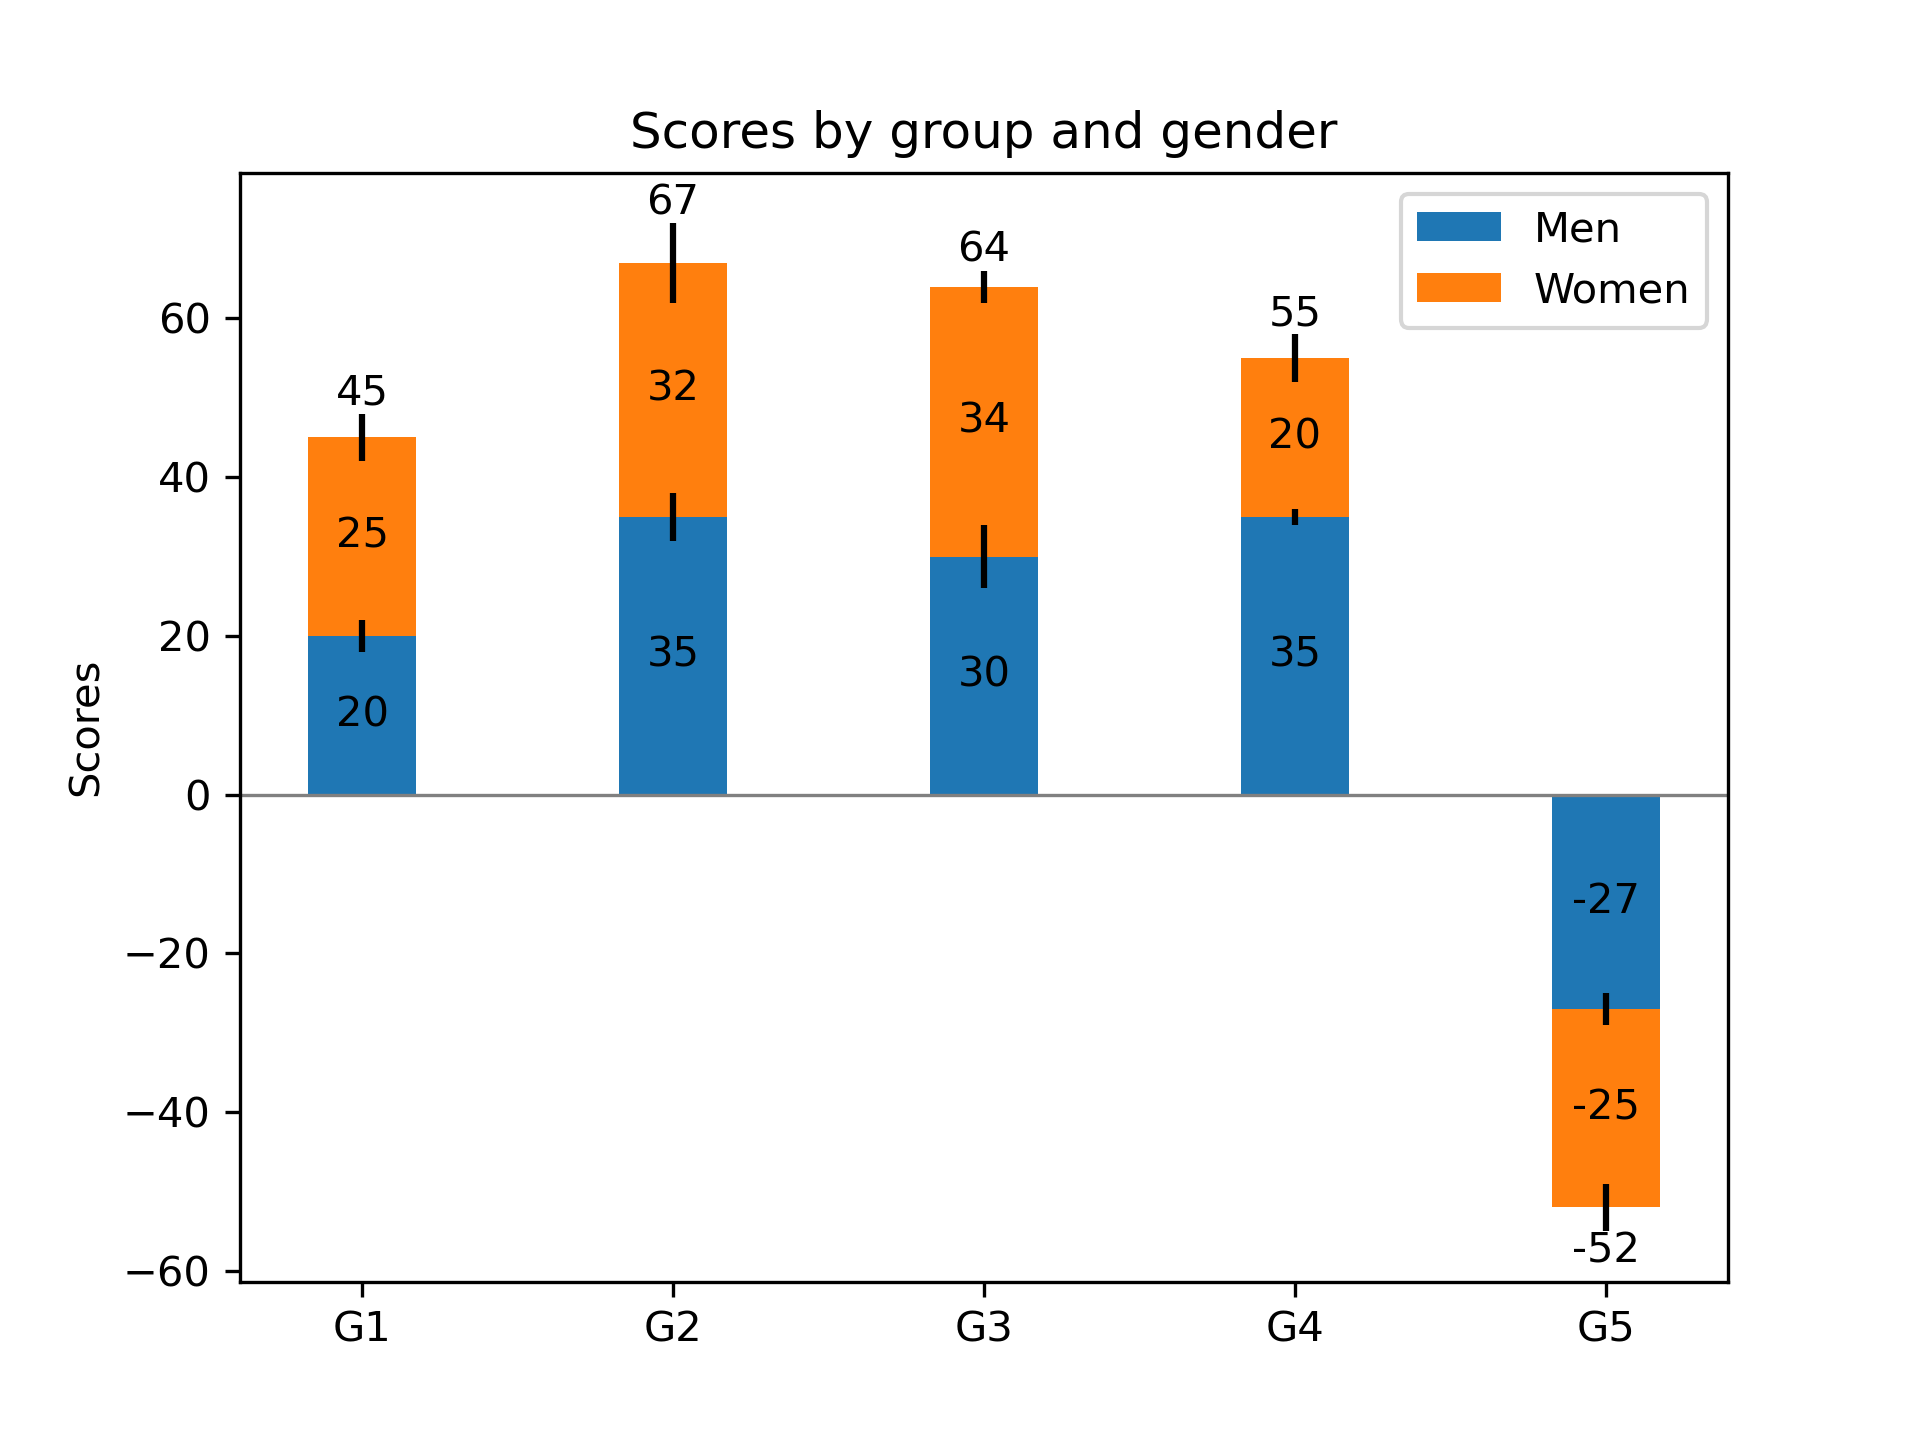
... ###############################################################################
... # Stacked bar plot with error bars
...
... fig, ax = plt.subplots()
...
... p1 = ax.bar(ind, menMeans, width, yerr=menStd, label='Men')
... p2 = ax.bar(ind, womenMeans, width,
... bottom=menMeans, yerr=womenStd, label='Women')
...
... ax.axhline(0, color='grey', linewidth=0.8)
... ax.set_ylabel('Scores')
... ax.set_title('Scores by group and gender')
... ax.set_xticks(ind, labels=['G1', 'G2', 'G3', 'G4', 'G5'])
... ax.legend()
...
... # Label with label_type 'center' instead of the default 'edge'
... ax.bar_label(p1, label_type='center')
... ax.bar_label(p2, label_type='center')
... ax.bar_label(p2)
...
... plt.show()
...
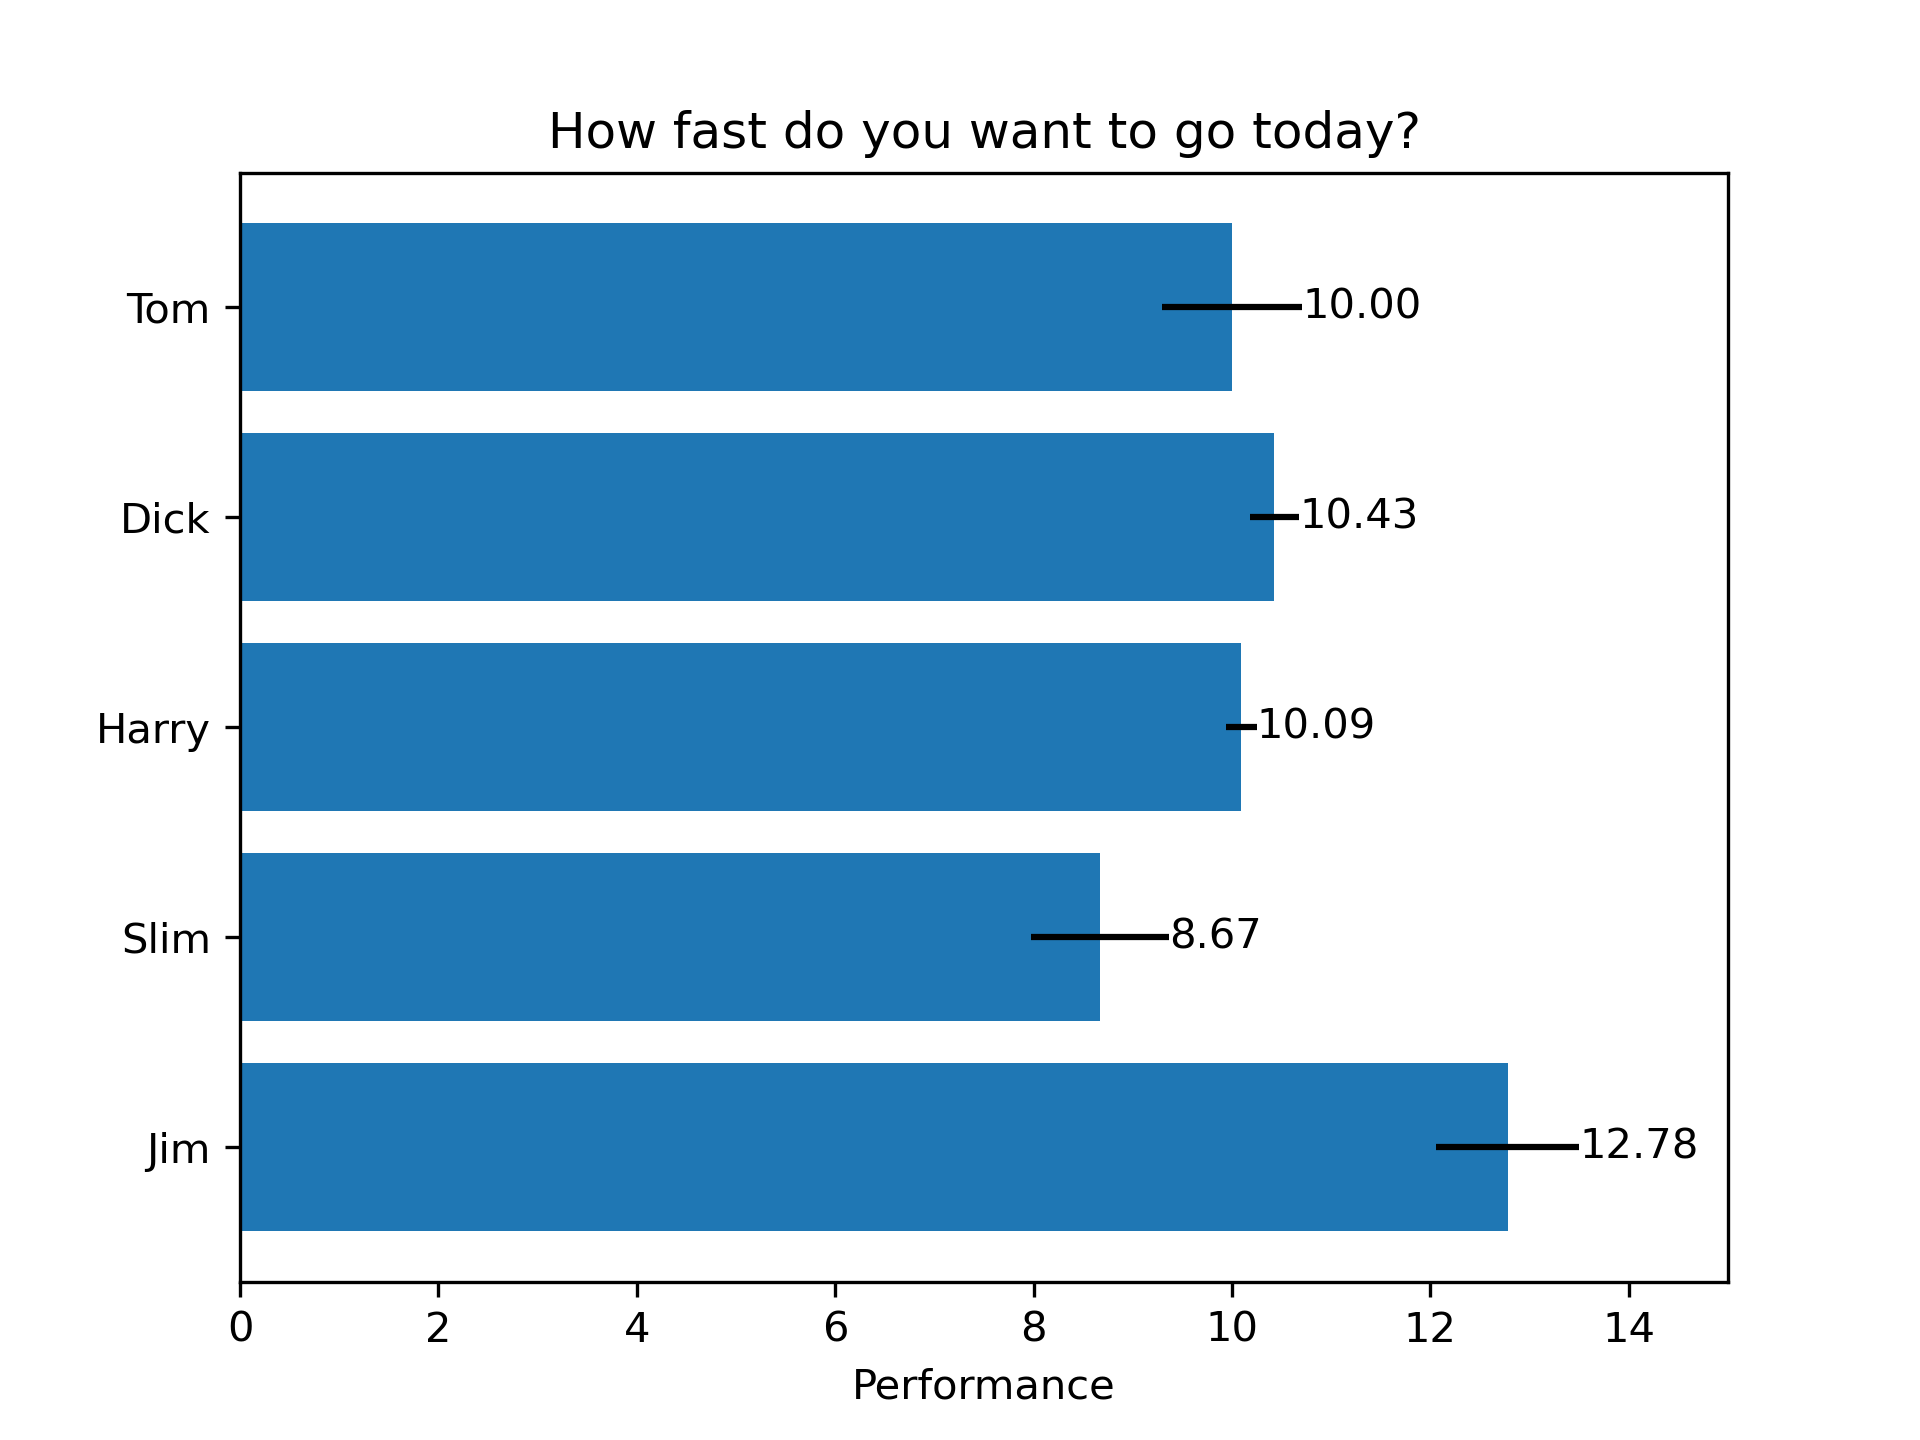
... ###############################################################################
... # Horizontal bar chart
...
... # Fixing random state for reproducibility
... np.random.seed(19680801)
...
... # Example data
... people = ('Tom', 'Dick', 'Harry', 'Slim', 'Jim')
... y_pos = np.arange(len(people))
... performance = 3 + 10 * np.random.rand(len(people))
... error = np.random.rand(len(people))
...
... fig, ax = plt.subplots()
...
... hbars = ax.barh(y_pos, performance, xerr=error, align='center')
... ax.set_yticks(y_pos, labels=people)
... ax.invert_yaxis() # labels read top-to-bottom
... ax.set_xlabel('Performance')
... ax.set_title('How fast do you want to go today?')
...
... # Label with specially formatted floats
... ax.bar_label(hbars, fmt='%.2f')
... ax.set_xlim(right=15) # adjust xlim to fit labels
...
... plt.show()
...
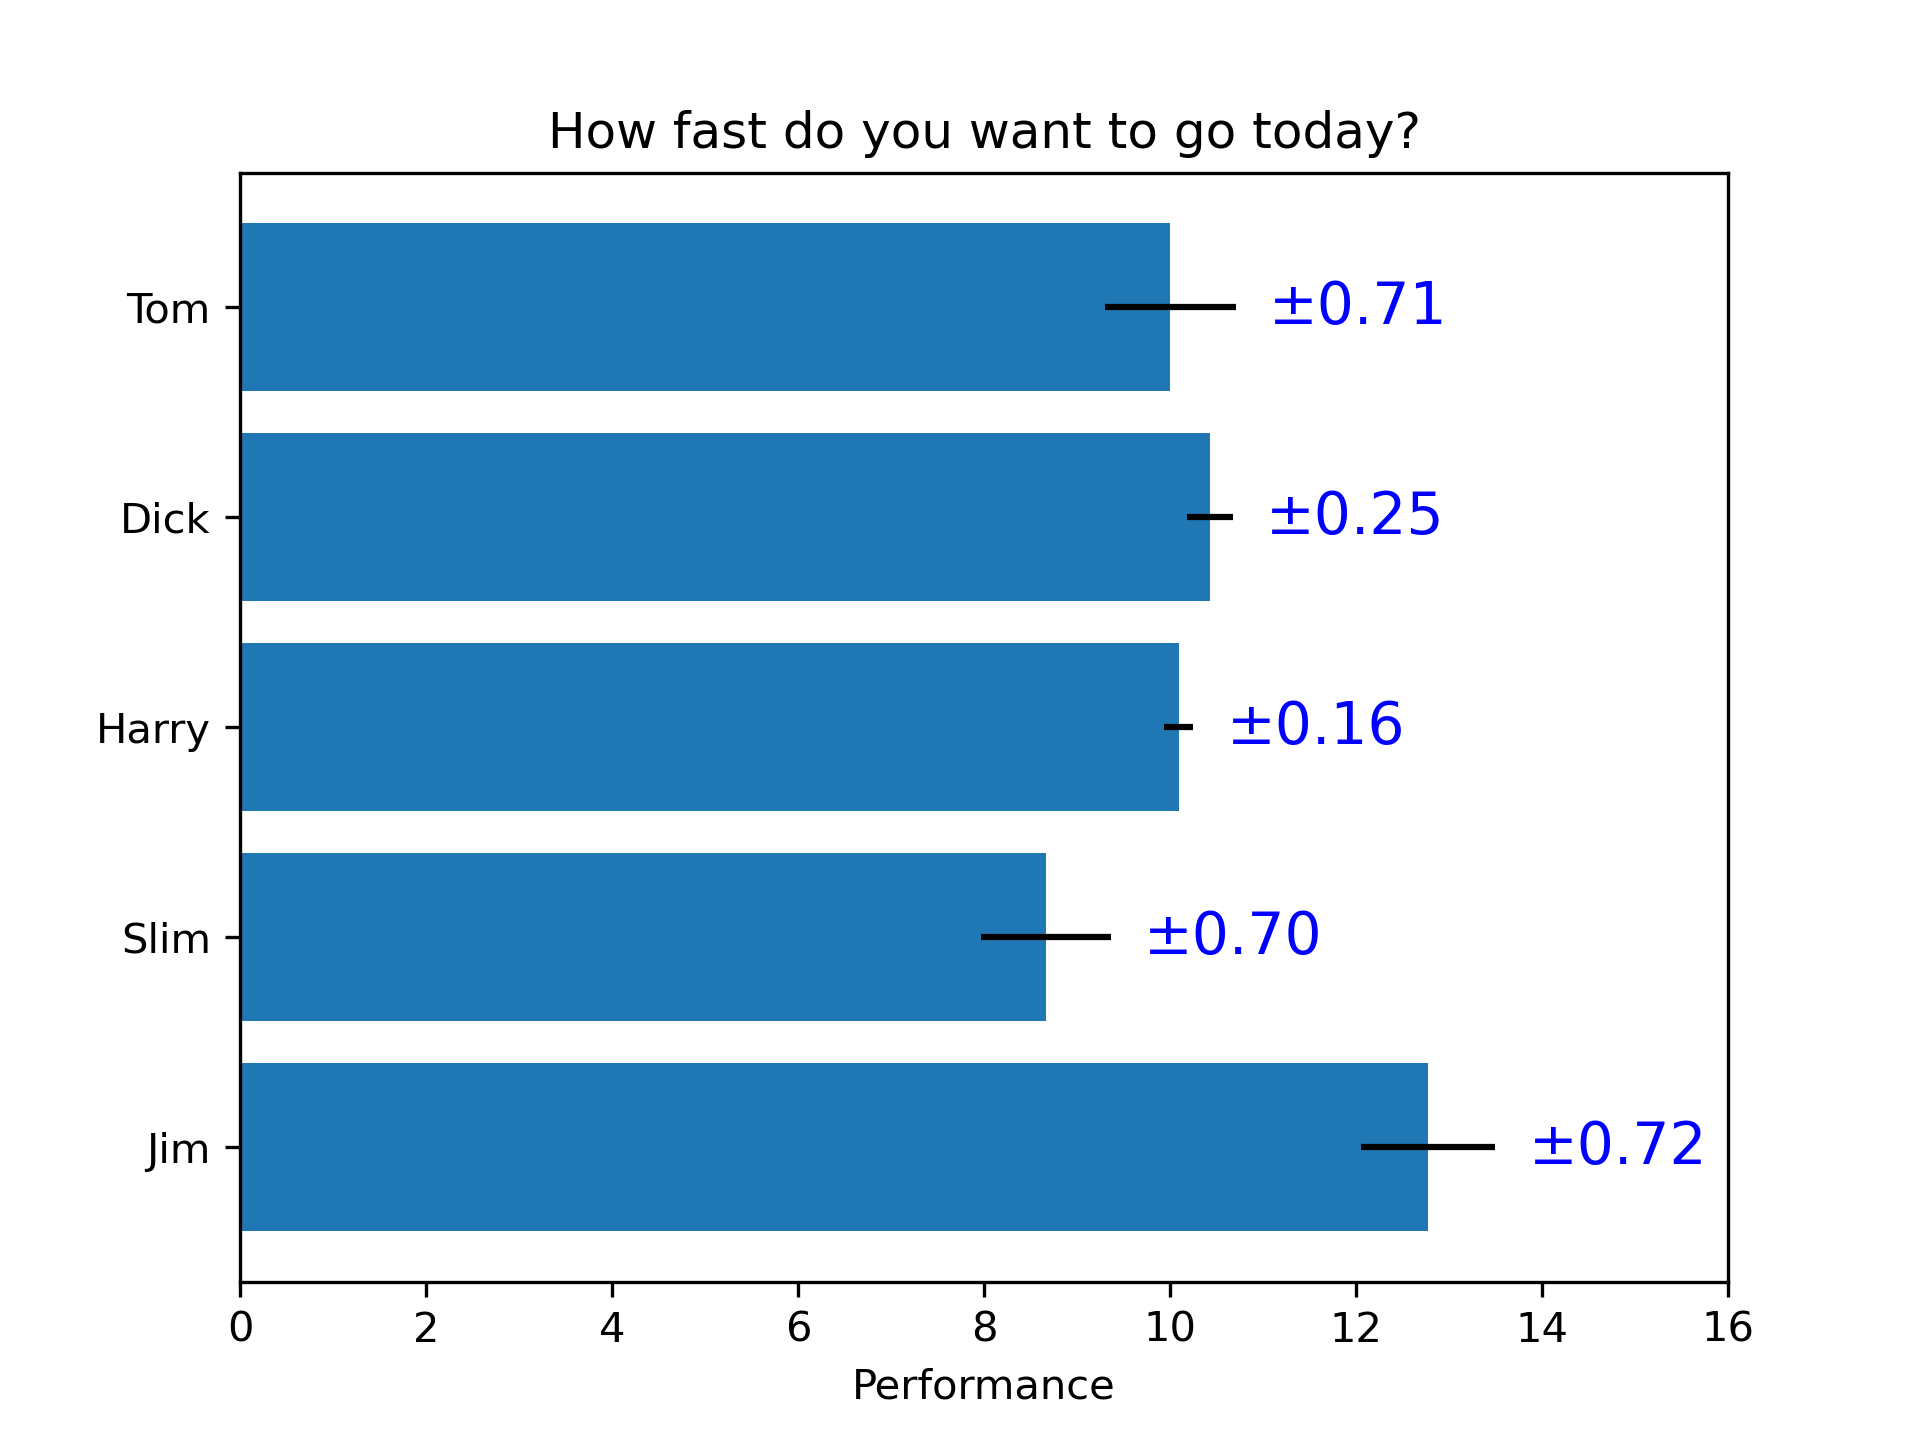
... ###############################################################################
... # Some of the more advanced things that one can do with bar labels
...
... fig, ax = plt.subplots()
...
... hbars = ax.barh(y_pos, performance, xerr=error, align='center')
... ax.set_yticks(y_pos, labels=people)
... ax.invert_yaxis() # labels read top-to-bottom
... ax.set_xlabel('Performance')
... ax.set_title('How fast do you want to go today?')
...
... # Label with given captions, custom padding and annotate options
... ax.bar_label(hbars, labels=['±%.2f' % e for e in error],
... padding=8, color='b', fontsize=14)
... ax.set_xlim(right=16)
...
... plt.show()
...
... #############################################################################
... #
... # .. admonition:: References
... #
... # The use of the following functions, methods, classes and modules is shown
... # in this example:
... #
... # - `matplotlib.axes.Axes.bar` / `matplotlib.pyplot.bar`
... # - `matplotlib.axes.Axes.barh` / `matplotlib.pyplot.barh`
... # - `matplotlib.axes.Axes.bar_label` / `matplotlib.pyplot.bar_label`
...