>>> """
==============
Infinite lines
==============
`~.axes.Axes.axvline` and `~.axes.Axes.axhline` draw infinite vertical /
horizontal lines, at given *x* / *y* positions. They are usually used to mark
special data values, e.g. in this example the center and limit values of the
sigmoid function.
`~.axes.Axes.axline` draws infinite straight lines in arbitrary directions.
"""
... import numpy as np
... import matplotlib.pyplot as plt
...
... t = np.linspace(-10, 10, 100)
... sig = 1 / (1 + np.exp(-t))
...
... plt.axhline(y=0, color="black", linestyle="--")
... plt.axhline(y=0.5, color="black", linestyle=":")
... plt.axhline(y=1.0, color="black", linestyle="--")
... plt.axvline(color="grey")
... plt.axline((0, 0.5), slope=0.25, color="black", linestyle=(0, (5, 5)))
... plt.plot(t, sig, linewidth=2, label=r"$\sigma(t) = \frac{1}{1 + e^{-t}}$")
... plt.xlim(-10, 10)
... plt.xlabel("t")
... plt.legend(fontsize=14)
... plt.show()
...
... ##############################################################################
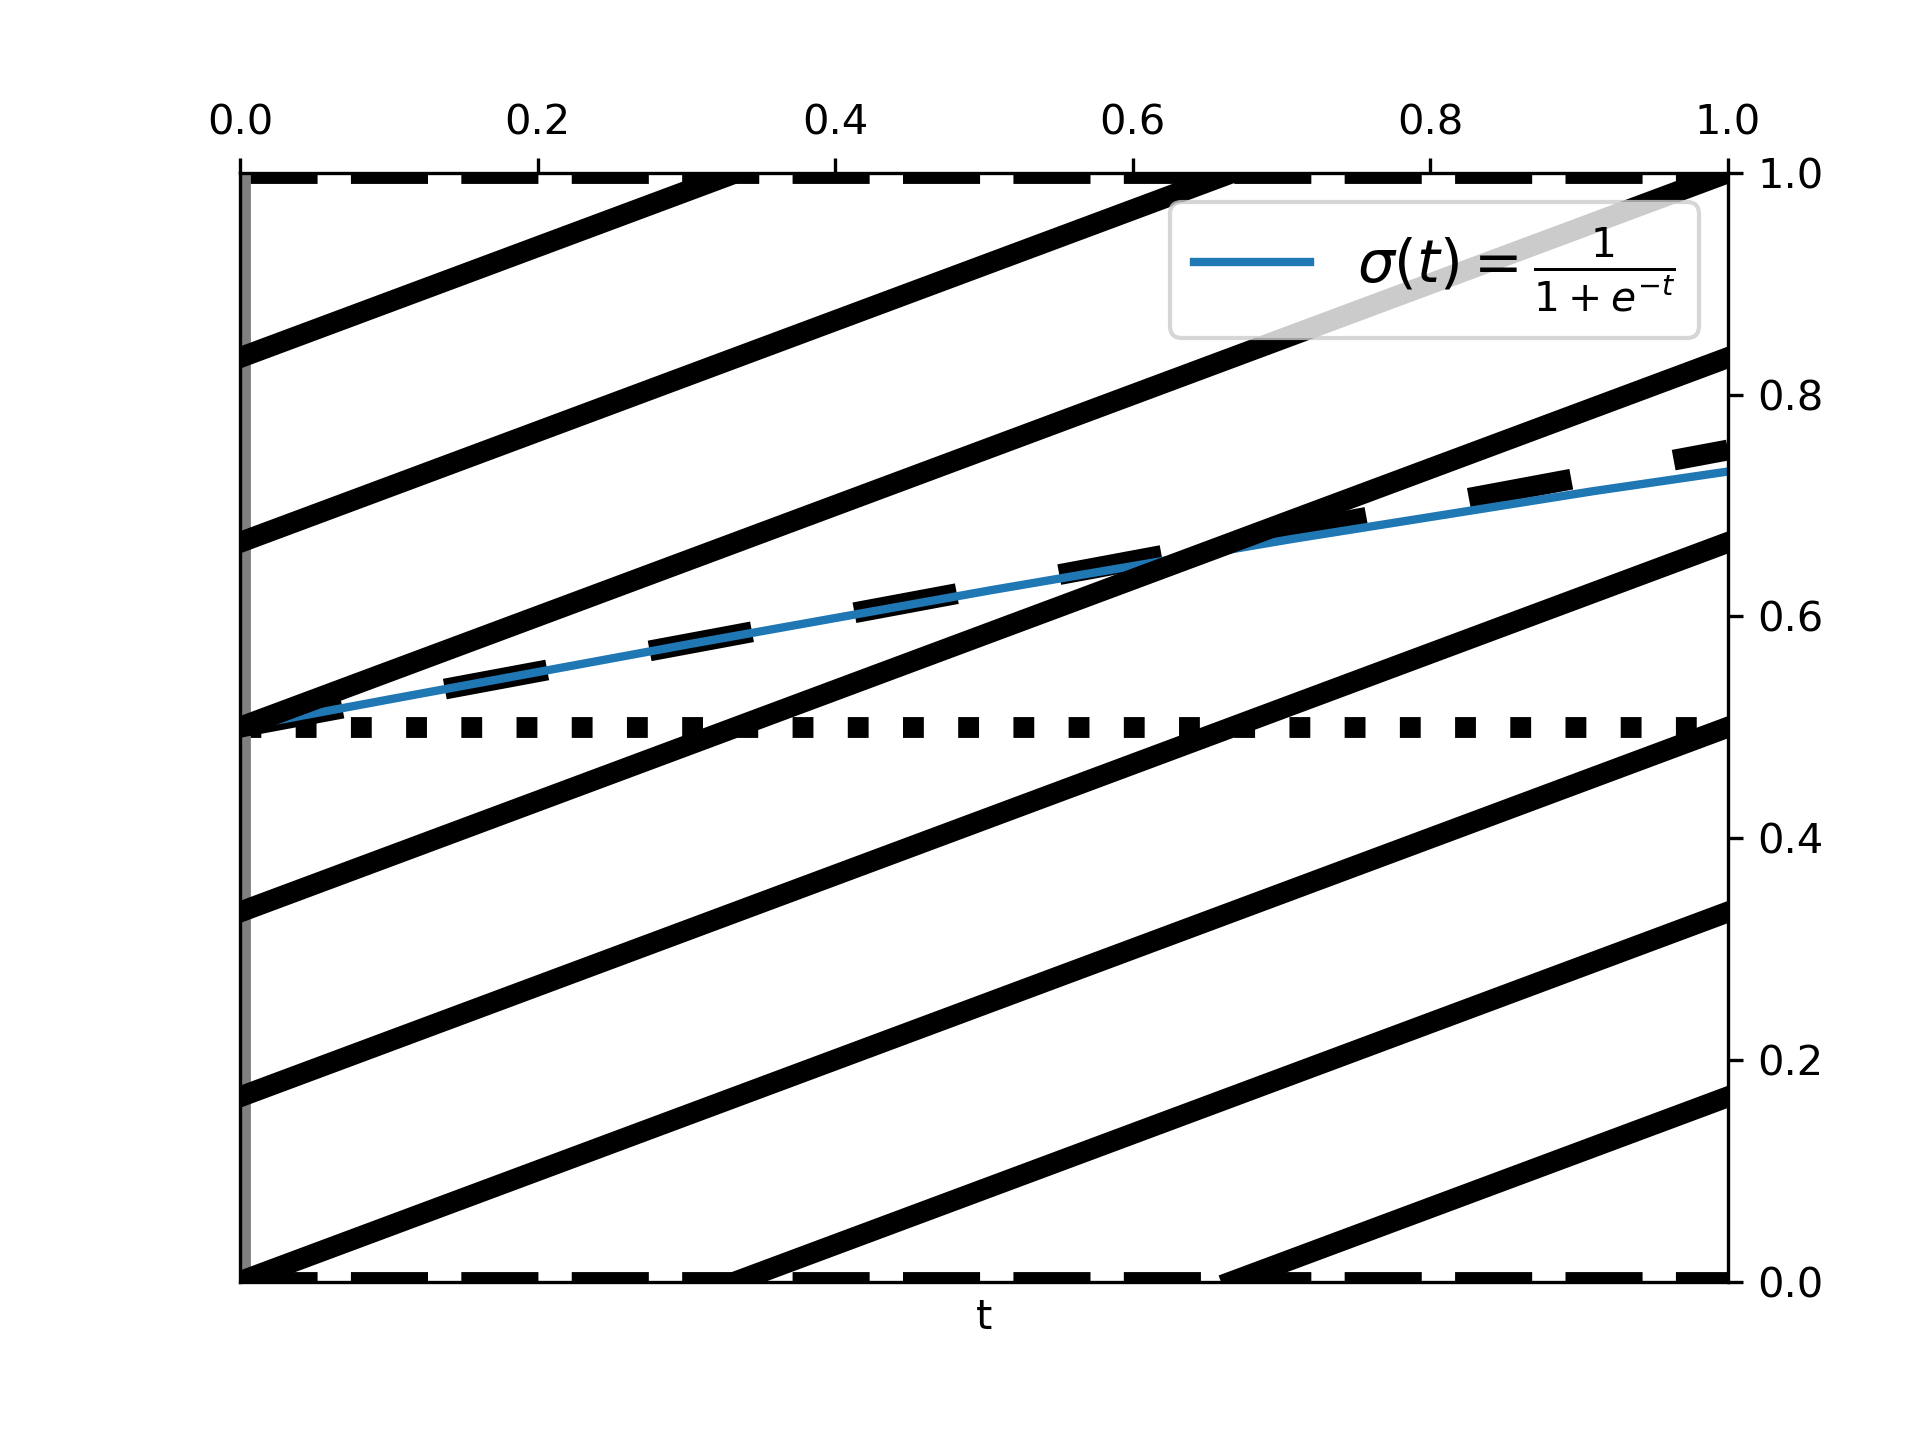
... # `~.axes.Axes.axline` can also be used with a ``transform`` parameter, which
... # applies to the point, but not to the slope. This can be useful for drawing
... # diagonal grid lines with a fixed slope, which stay in place when the
... # plot limits are moved.
...
... for pos in np.linspace(-2, 1, 10):
... plt.axline((pos, 0), slope=0.5, color='k', transform=plt.gca().transAxes)
...
... plt.ylim([0, 1])
... plt.xlim([0, 1])
... plt.show()
...
... #############################################################################
... #
... # .. admonition:: References
... #
... # The use of the following functions, methods, classes and modules is shown
... # in this example:
... #
... # - `matplotlib.axes.Axes.axhline` / `matplotlib.pyplot.axhline`
... # - `matplotlib.axes.Axes.axvline` / `matplotlib.pyplot.axvline`
... # - `matplotlib.axes.Axes.axline` / `matplotlib.pyplot.axline`
...