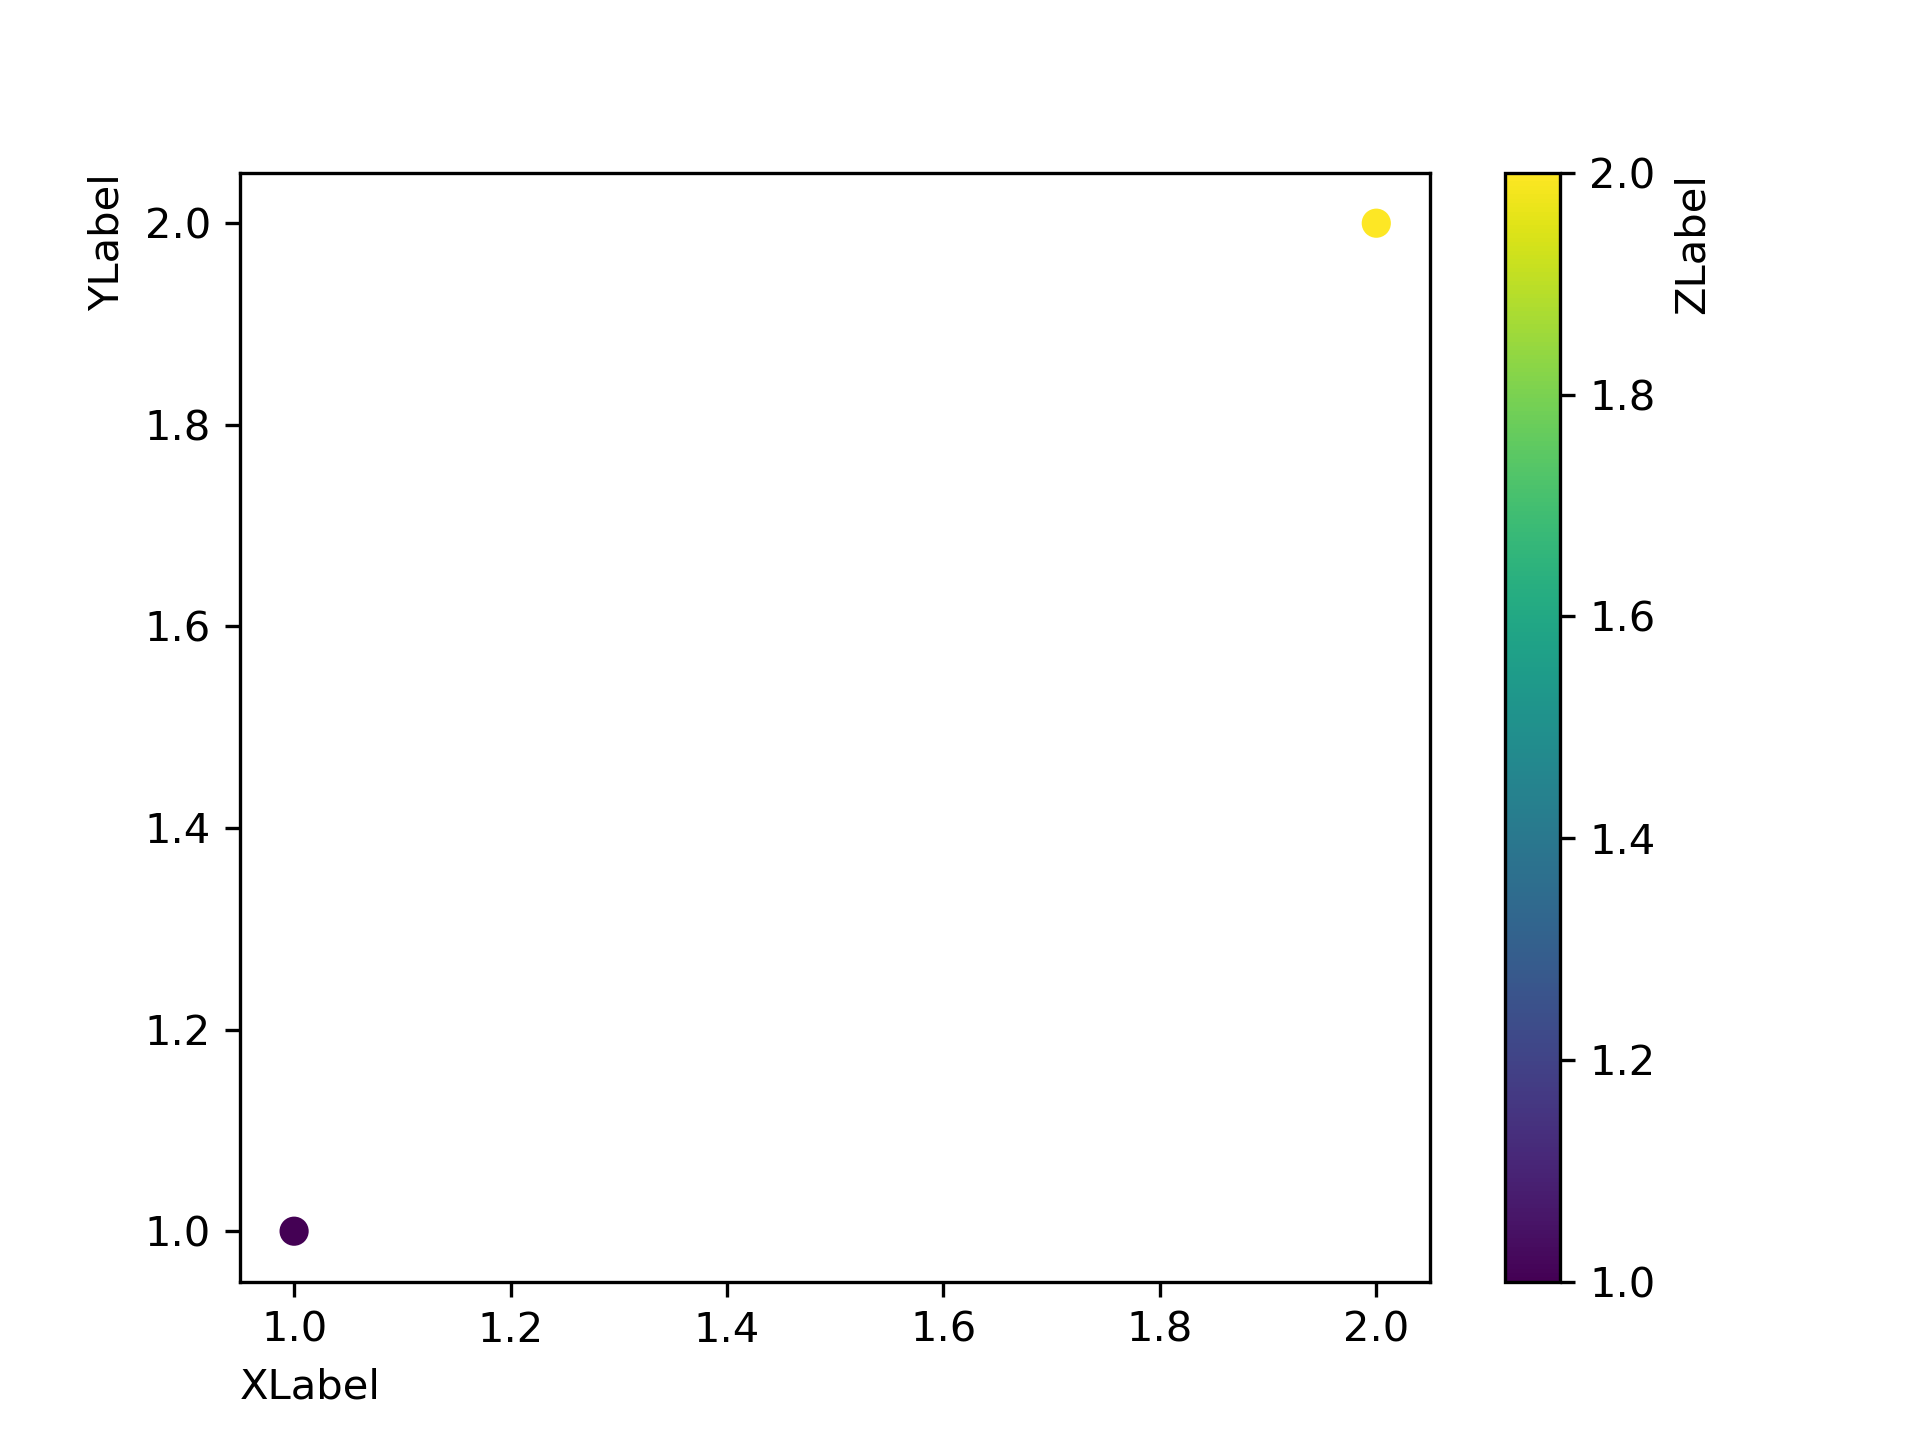
>>> """
===================
Axis Label Position
===================

Choose axis label position when calling `~.Axes.set_xlabel` and
`~.Axes.set_ylabel` as well as for colorbar.

"""
... import matplotlib.pyplot as plt
...
... fig, ax = plt.subplots()
...
... sc = ax.scatter([1, 2], [1, 2], c=[1, 2])
... ax.set_ylabel('YLabel', loc='top')
... ax.set_xlabel('XLabel', loc='left')
... cbar = fig.colorbar(sc)
... cbar.set_label("ZLabel", loc='top')
...
... plt.show()
...