>>> """
=======================
Equal axis aspect ratio
=======================
How to set and adjust plots with equal axis aspect ratios.
"""
...
... import matplotlib.pyplot as plt
... import numpy as np
...
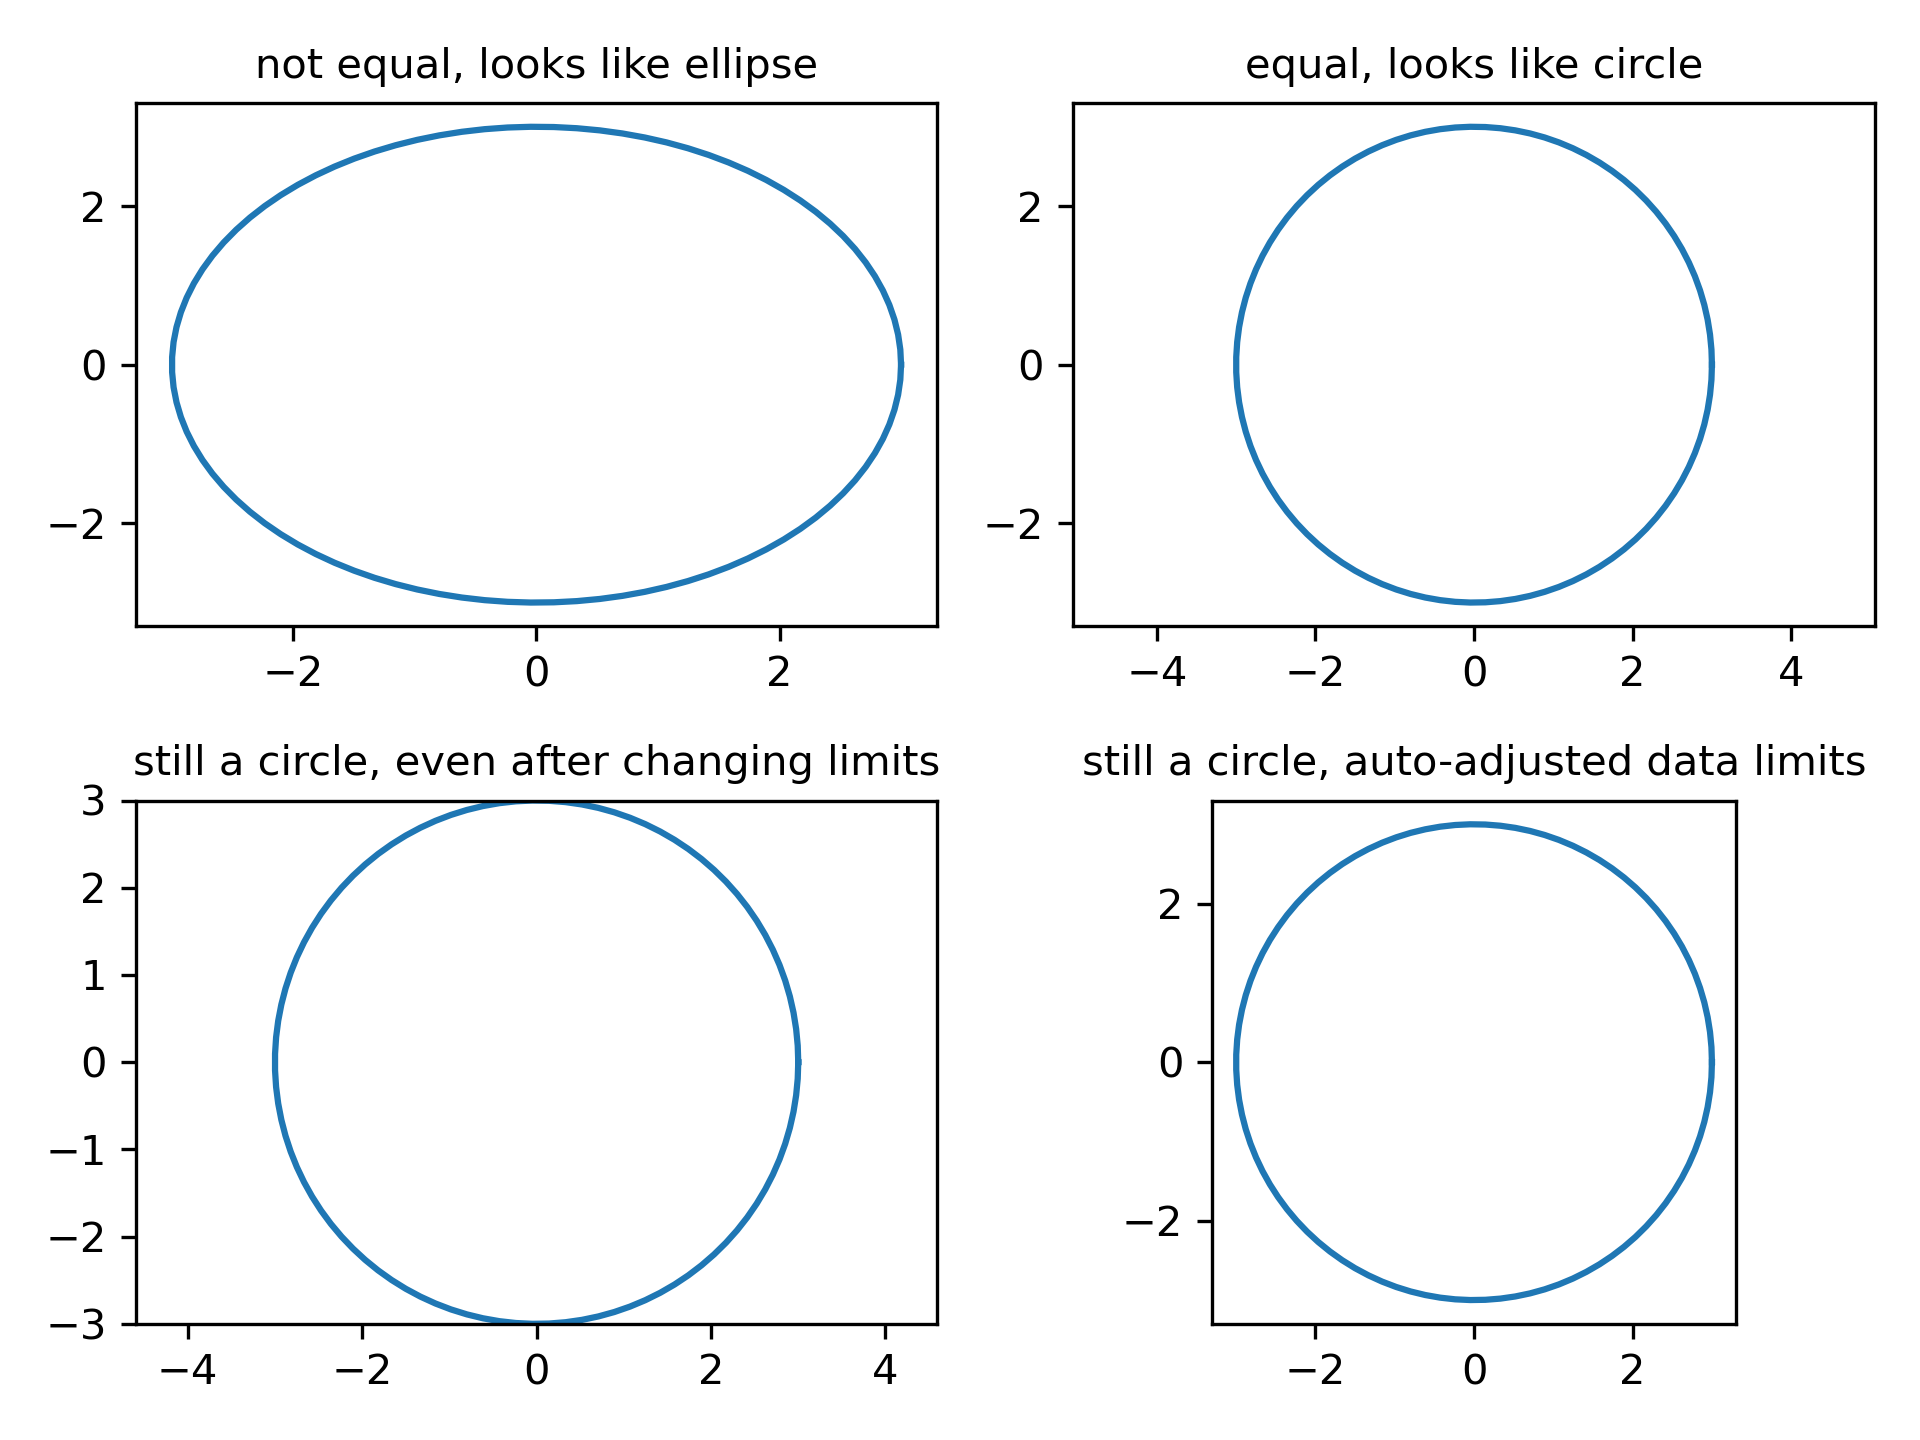
... # Plot circle of radius 3.
...
... an = np.linspace(0, 2 * np.pi, 100)
... fig, axs = plt.subplots(2, 2)
...
... axs[0, 0].plot(3 * np.cos(an), 3 * np.sin(an))
... axs[0, 0].set_title('not equal, looks like ellipse', fontsize=10)
...
... axs[0, 1].plot(3 * np.cos(an), 3 * np.sin(an))
... axs[0, 1].axis('equal')
... axs[0, 1].set_title('equal, looks like circle', fontsize=10)
...
... axs[1, 0].plot(3 * np.cos(an), 3 * np.sin(an))
... axs[1, 0].axis('equal')
... axs[1, 0].set(xlim=(-3, 3), ylim=(-3, 3))
... axs[1, 0].set_title('still a circle, even after changing limits', fontsize=10)
...
... axs[1, 1].plot(3 * np.cos(an), 3 * np.sin(an))
... axs[1, 1].set_aspect('equal', 'box')
... axs[1, 1].set_title('still a circle, auto-adjusted data limits', fontsize=10)
...
... fig.tight_layout()
...
... plt.show()
...