>>> """
=============
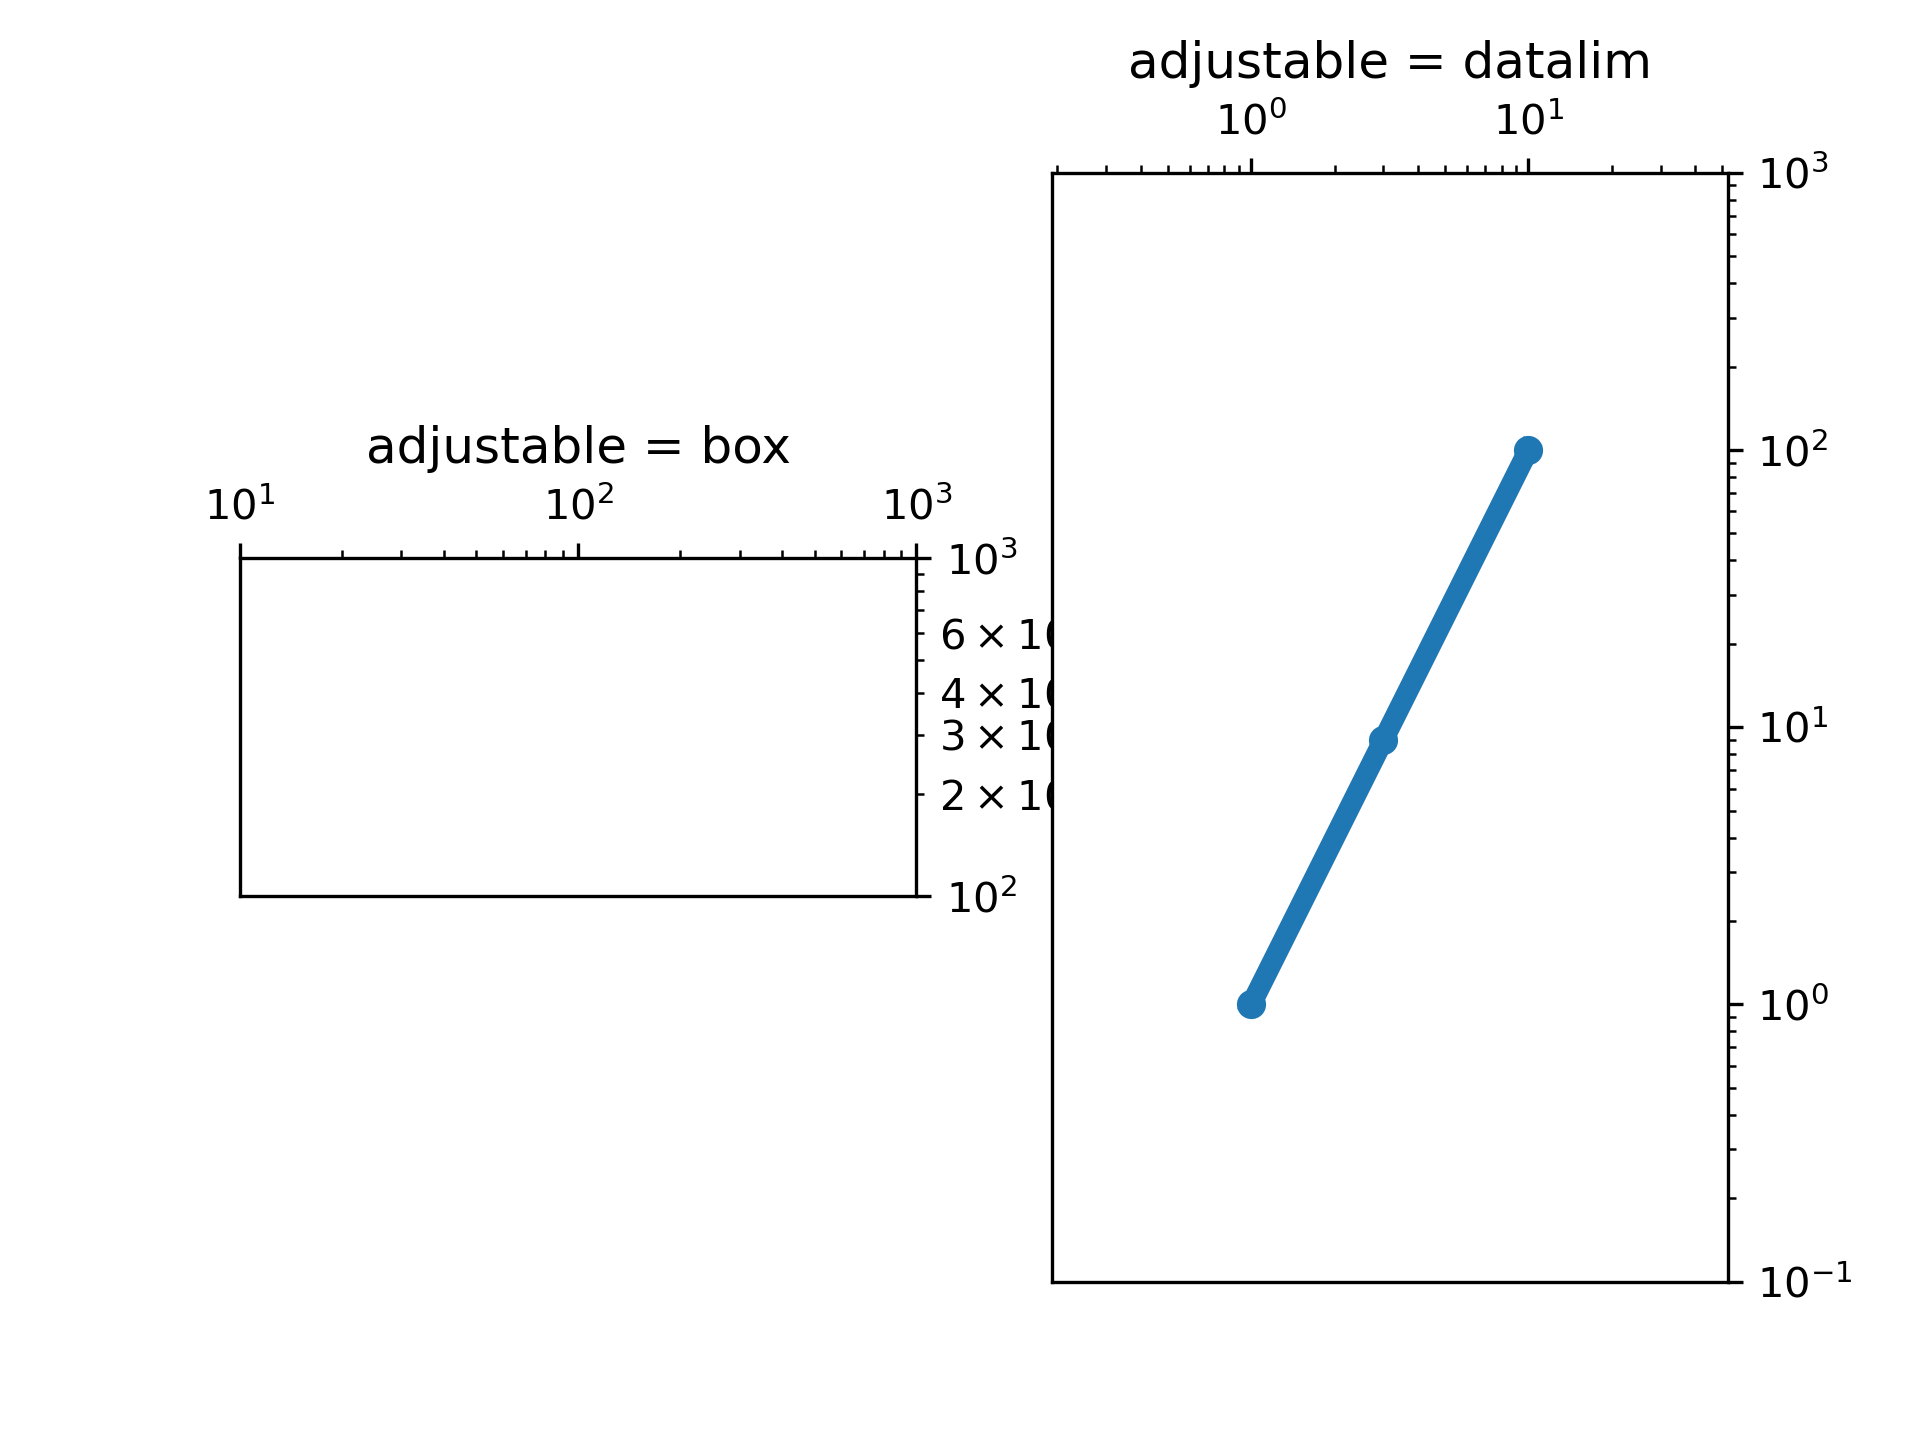
Loglog Aspect
=============
"""
... import matplotlib.pyplot as plt
...
... fig, (ax1, ax2) = plt.subplots(1, 2)
... ax1.set_xscale("log")
... ax1.set_yscale("log")
... ax1.set_xlim(1e1, 1e3)
... ax1.set_ylim(1e2, 1e3)
... ax1.set_aspect(1)
... ax1.set_title("adjustable = box")
...
... ax2.set_xscale("log")
... ax2.set_yscale("log")
... ax2.set_adjustable("datalim")
... ax2.plot([1, 3, 10], [1, 9, 100], "o-")
... ax2.set_xlim(1e-1, 1e2)
... ax2.set_ylim(1e-1, 1e3)
... ax2.set_aspect(1)
... ax2.set_title("adjustable = datalim")
...
... plt.show()
...