>>> """
================================
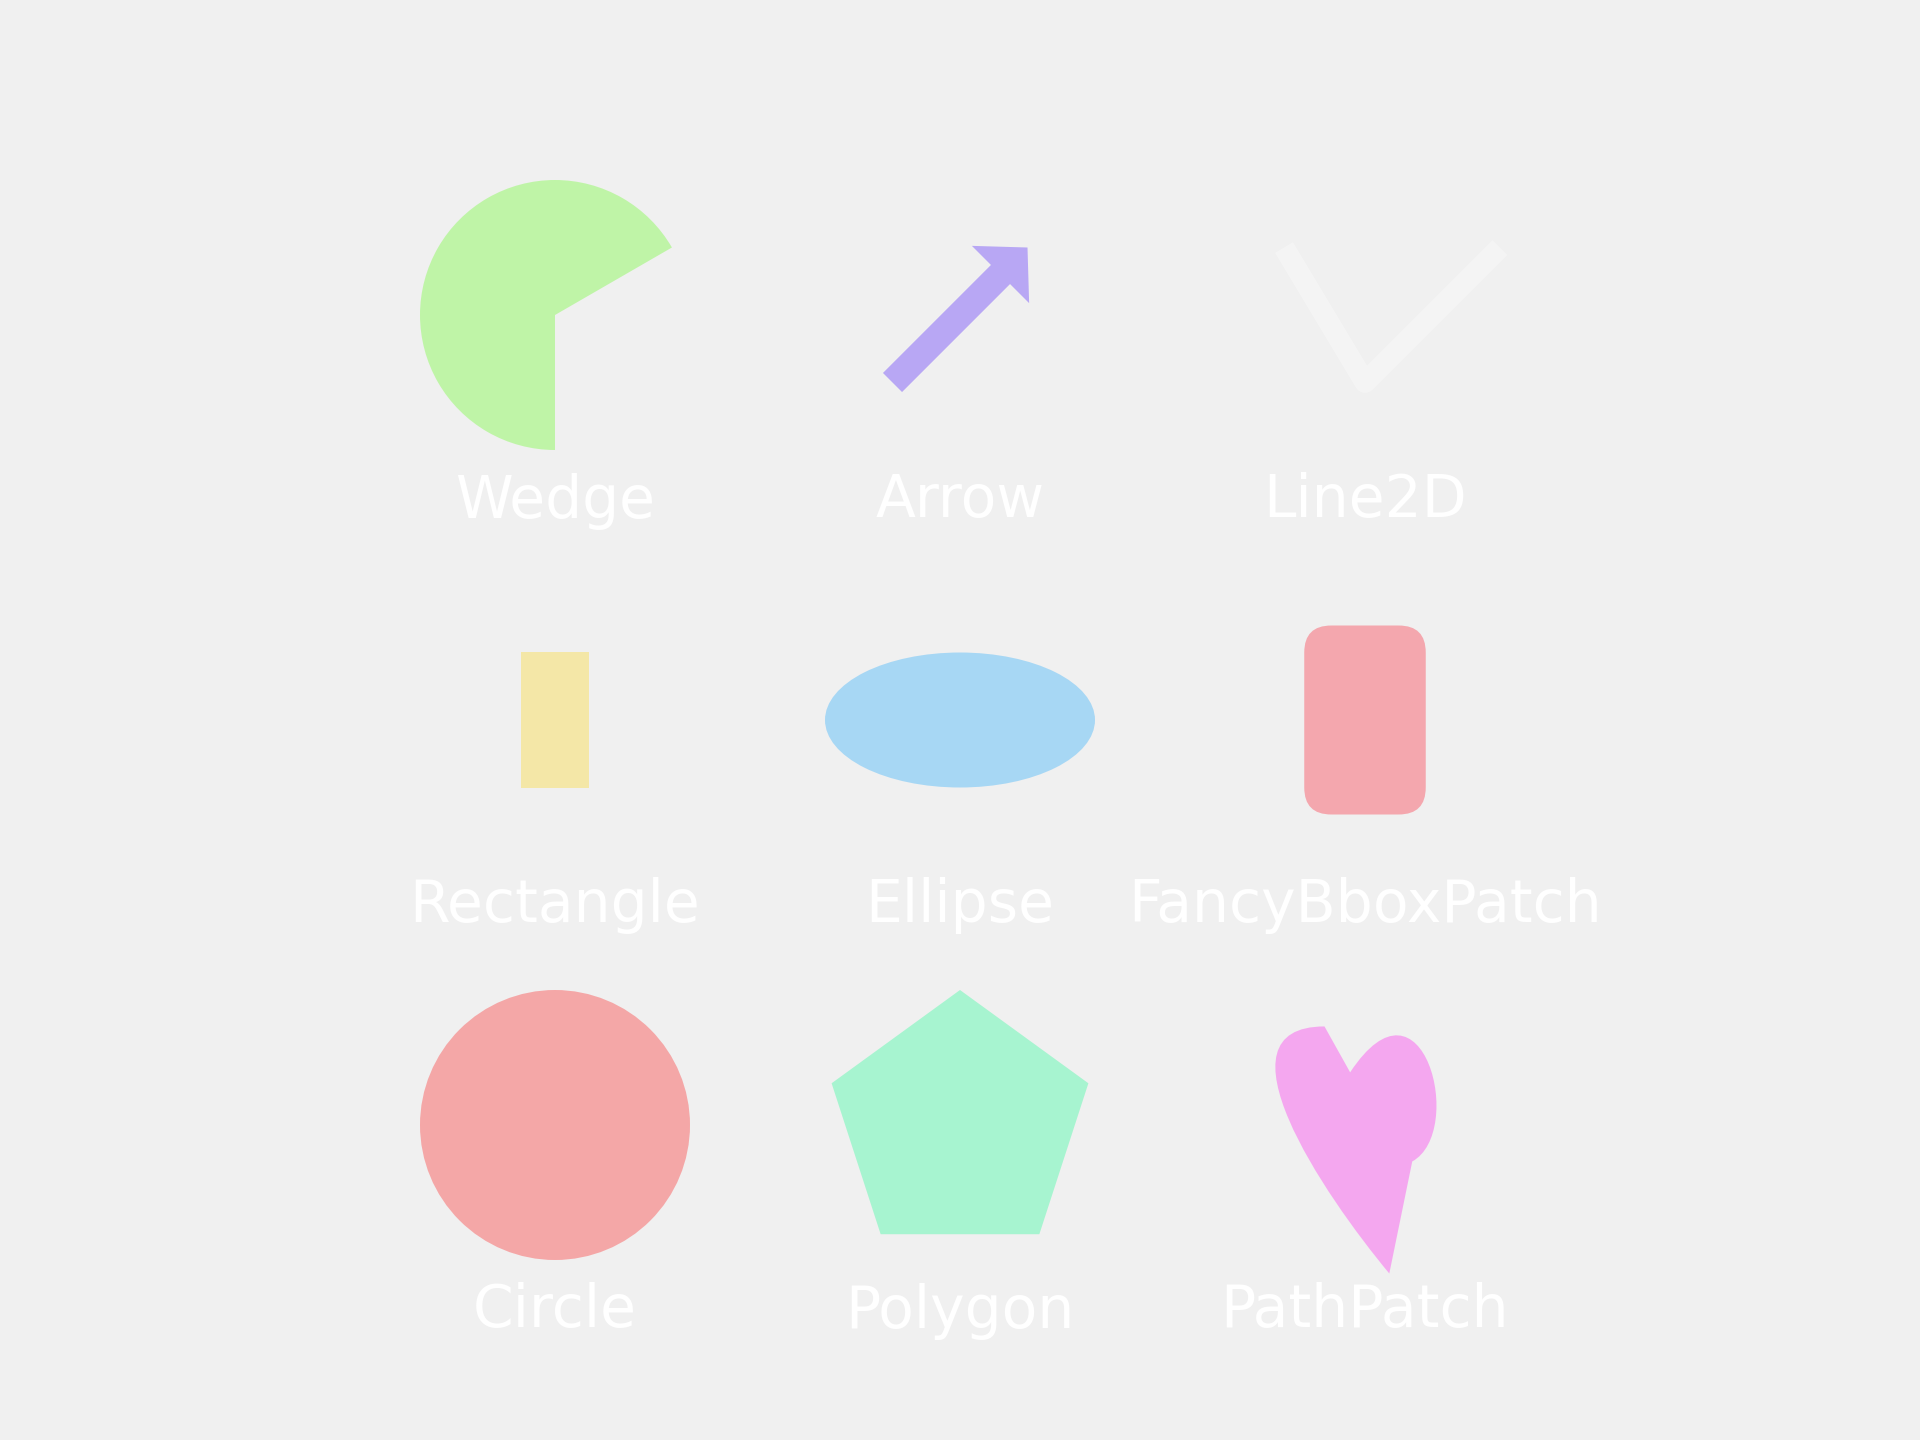
Reference for Matplotlib artists
================================
This example displays several of Matplotlib's graphics primitives (artists)
drawn using matplotlib API. A full list of artists and the documentation is
available at :ref:`the artist API <artist-api>`.
Copyright (c) 2010, Bartosz Telenczuk
BSD License
"""
... import matplotlib.pyplot as plt
... import numpy as np
... import matplotlib.path as mpath
... import matplotlib.lines as mlines
... import matplotlib.patches as mpatches
... from matplotlib.collections import PatchCollection
...
...
... def label(xy, text):
... y = xy[1] - 0.15 # shift y-value for label so that it's below the artist
... plt.text(xy[0], y, text, ha="center", family='sans-serif', size=14)
...
...
... fig, ax = plt.subplots()
... # create 3x3 grid to plot the artists
... grid = np.mgrid[0.2:0.8:3j, 0.2:0.8:3j].reshape(2, -1).T
...
... patches = []
...
... # add a circle
... circle = mpatches.Circle(grid[0], 0.1, ec="none")
... patches.append(circle)
... label(grid[0], "Circle")
...
... # add a rectangle
... rect = mpatches.Rectangle(grid[1] - [0.025, 0.05], 0.05, 0.1, ec="none")
... patches.append(rect)
... label(grid[1], "Rectangle")
...
... # add a wedge
... wedge = mpatches.Wedge(grid[2], 0.1, 30, 270, ec="none")
... patches.append(wedge)
... label(grid[2], "Wedge")
...
... # add a Polygon
... polygon = mpatches.RegularPolygon(grid[3], 5, 0.1)
... patches.append(polygon)
... label(grid[3], "Polygon")
...
... # add an ellipse
... ellipse = mpatches.Ellipse(grid[4], 0.2, 0.1)
... patches.append(ellipse)
... label(grid[4], "Ellipse")
...
... # add an arrow
... arrow = mpatches.Arrow(grid[5, 0] - 0.05, grid[5, 1] - 0.05, 0.1, 0.1,
... width=0.1)
... patches.append(arrow)
... label(grid[5], "Arrow")
...
... # add a path patch
... Path = mpath.Path
... path_data = [
... (Path.MOVETO, [0.018, -0.11]),
... (Path.CURVE4, [-0.031, -0.051]),
... (Path.CURVE4, [-0.115, 0.073]),
... (Path.CURVE4, [-0.03, 0.073]),
... (Path.LINETO, [-0.011, 0.039]),
... (Path.CURVE4, [0.043, 0.121]),
... (Path.CURVE4, [0.075, -0.005]),
... (Path.CURVE4, [0.035, -0.027]),
... (Path.CLOSEPOLY, [0.018, -0.11])]
... codes, verts = zip(*path_data)
... path = mpath.Path(verts + grid[6], codes)
... patch = mpatches.PathPatch(path)
... patches.append(patch)
... label(grid[6], "PathPatch")
...
... # add a fancy box
... fancybox = mpatches.FancyBboxPatch(
... grid[7] - [0.025, 0.05], 0.05, 0.1,
... boxstyle=mpatches.BoxStyle("Round", pad=0.02))
... patches.append(fancybox)
... label(grid[7], "FancyBboxPatch")
...
... # add a line
... x, y = ([-0.06, 0.0, 0.1], [0.05, -0.05, 0.05])
... line = mlines.Line2D(x + grid[8, 0], y + grid[8, 1], lw=5., alpha=0.3)
... label(grid[8], "Line2D")
...
... colors = np.linspace(0, 1, len(patches))
... collection = PatchCollection(patches, cmap=plt.cm.hsv, alpha=0.3)
... collection.set_array(colors)
... ax.add_collection(collection)
... ax.add_line(line)
...
... plt.axis('equal')
... plt.axis('off')
... plt.tight_layout()
...
... plt.show()
...
... #############################################################################
... #
... # .. admonition:: References
... #
... # The use of the following functions, methods, classes and modules is shown
... # in this example:
... #
... # - `matplotlib.path`
... # - `matplotlib.path.Path`
... # - `matplotlib.lines`
... # - `matplotlib.lines.Line2D`
... # - `matplotlib.patches`
... # - `matplotlib.patches.Circle`
... # - `matplotlib.patches.Ellipse`
... # - `matplotlib.patches.Wedge`
... # - `matplotlib.patches.Rectangle`
... # - `matplotlib.patches.Arrow`
... # - `matplotlib.patches.PathPatch`
... # - `matplotlib.patches.FancyBboxPatch`
... # - `matplotlib.patches.RegularPolygon`
... # - `matplotlib.collections`
... # - `matplotlib.collections.PatchCollection`
... # - `matplotlib.cm.ScalarMappable.set_array`
... # - `matplotlib.axes.Axes.add_collection`
... # - `matplotlib.axes.Axes.add_line`
...