>>> """
===========
Arrow guide
===========
Adding arrow patches to plots.
Arrows are often used to annotate plots. This tutorial shows how to plot arrows
that behave differently when the data limits on a plot are changed. In general,
points on a plot can either be fixed in "data space" or "display space".
Something plotted in data space moves when the data limits are altered - an
example would be the points in a scatter plot. Something plotted in display
space stays static when data limits are altered - an example would be a
figure title or the axis labels.
Arrows consist of a head (and possibly a tail) and a stem drawn between a
start point and end point, called 'anchor points' from now on.
Here we show three use cases for plotting arrows, depending on whether the
head or anchor points need to be fixed in data or display space:
1. Head shape fixed in display space, anchor points fixed in data space
2. Head shape and anchor points fixed in display space
3. Entire patch fixed in data space
Below each use case is presented in turn.
.. redirect-from:: /gallery/text_labels_and_annotations/arrow_simple_demo
"""
...
... import matplotlib.patches as mpatches
... import matplotlib.pyplot as plt
... x_tail = 0.1
... y_tail = 0.5
... x_head = 0.9
... y_head = 0.8
... dx = x_head - x_tail
... dy = y_head - y_tail
...
...
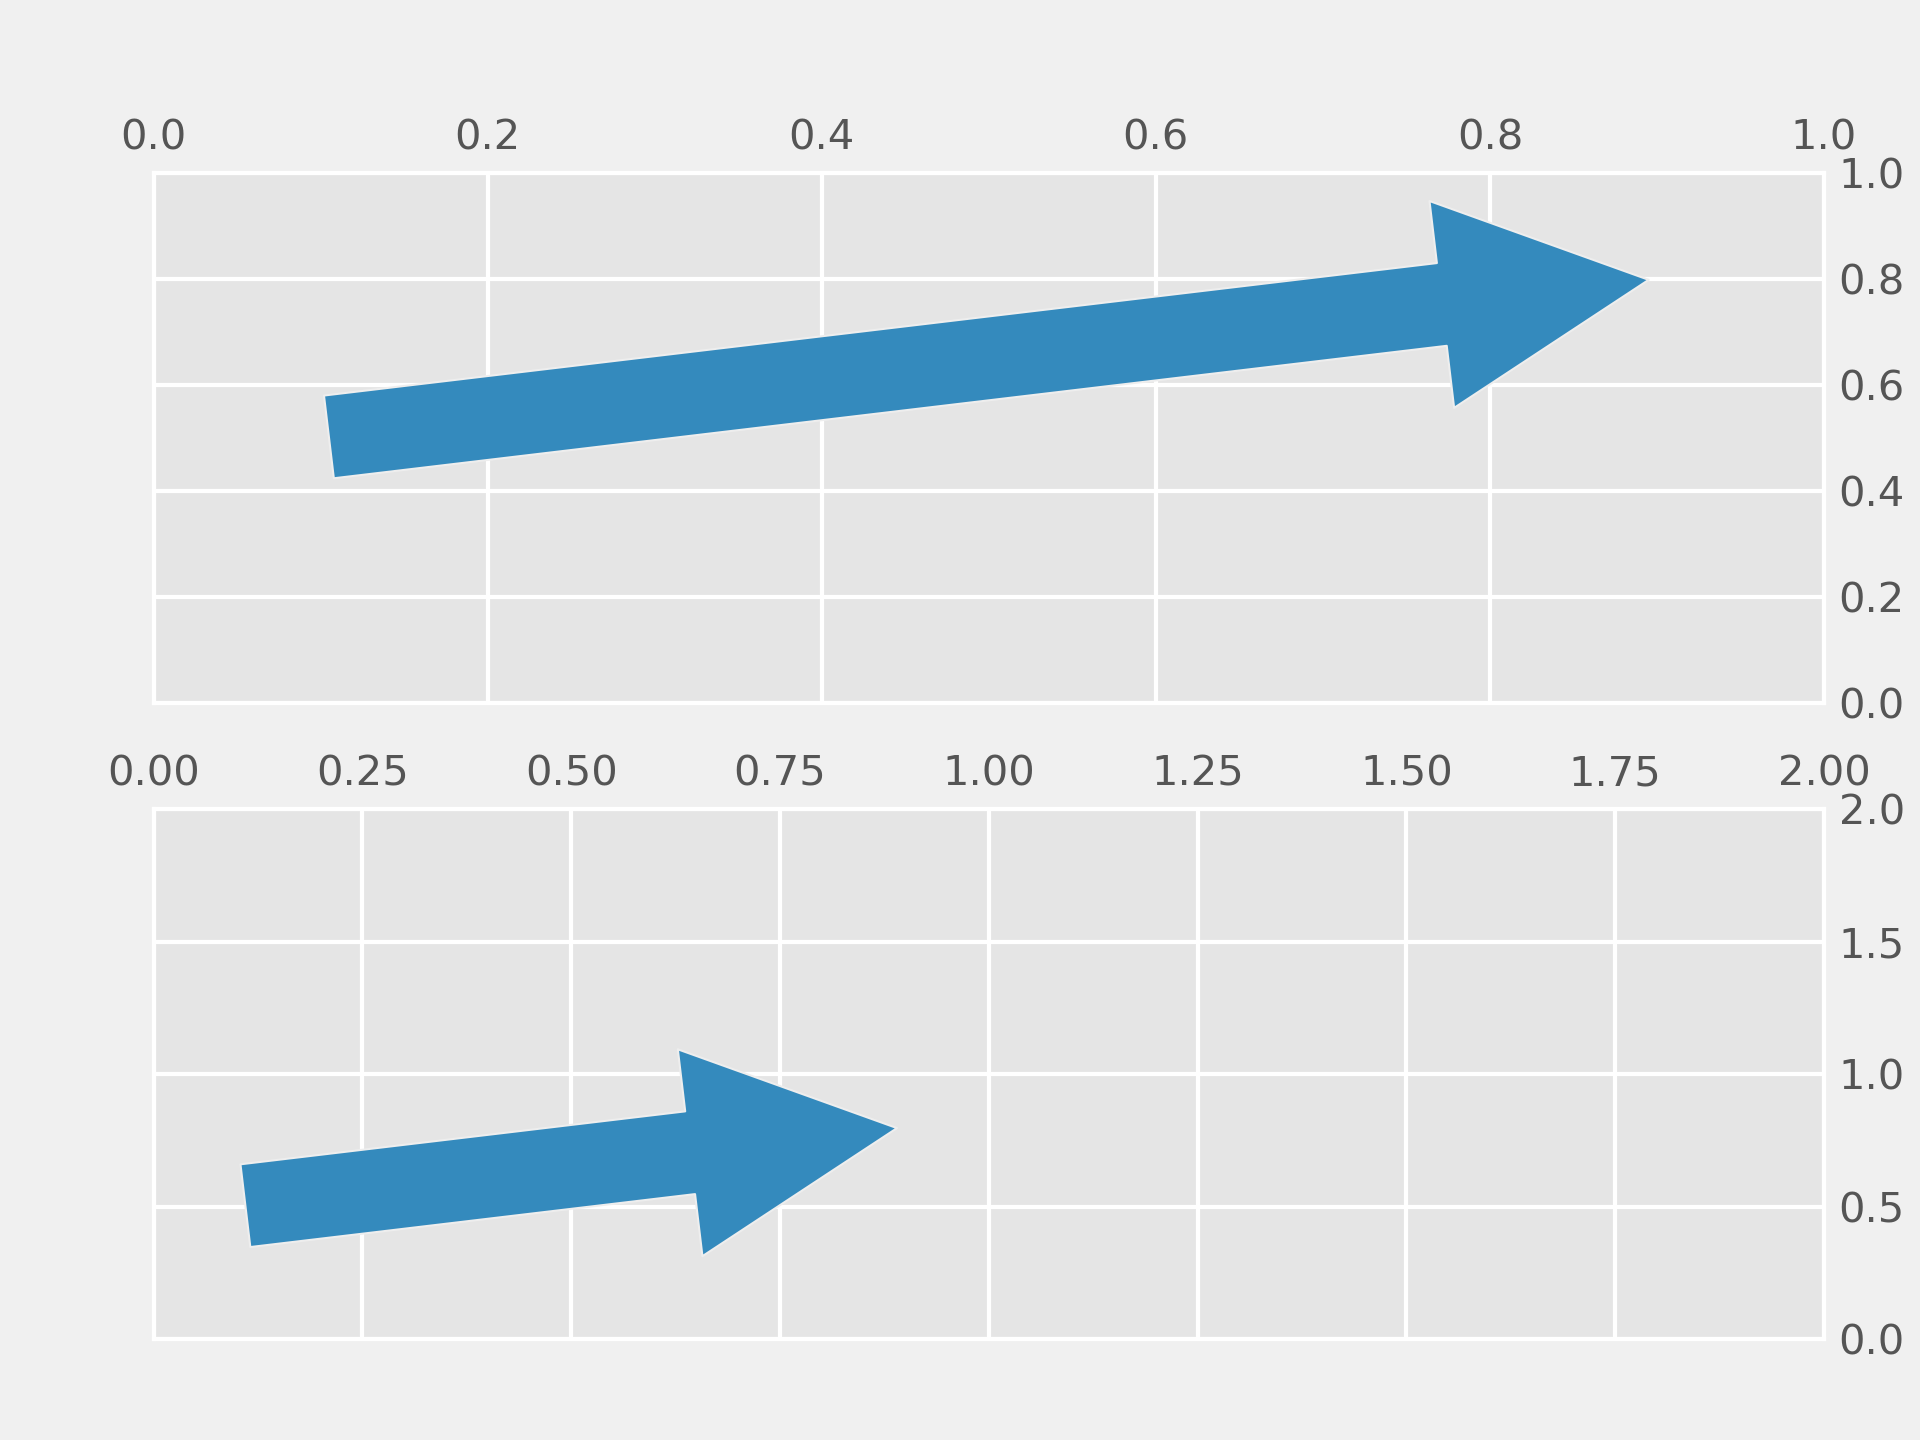
... ###############################################################################
... # Head shape fixed in display space and anchor points fixed in data space
... # -----------------------------------------------------------------------
... #
... # This is useful if you are annotating a plot, and don't want the arrow to
... # to change shape or position if you pan or scale the plot.
... #
... # In this case we use `.patches.FancyArrowPatch`.
... #
... # Note that when the axis limits are changed, the arrow shape stays the same,
... # but the anchor points move.
...
... fig, axs = plt.subplots(nrows=2)
... arrow = mpatches.FancyArrowPatch((x_tail, y_tail), (x_head, y_head),
... mutation_scale=100)
... axs[0].add_patch(arrow)
...
... arrow = mpatches.FancyArrowPatch((x_tail, y_tail), (x_head, y_head),
... mutation_scale=100)
... axs[1].add_patch(arrow)
... axs[1].set(xlim=(0, 2), ylim=(0, 2))
...
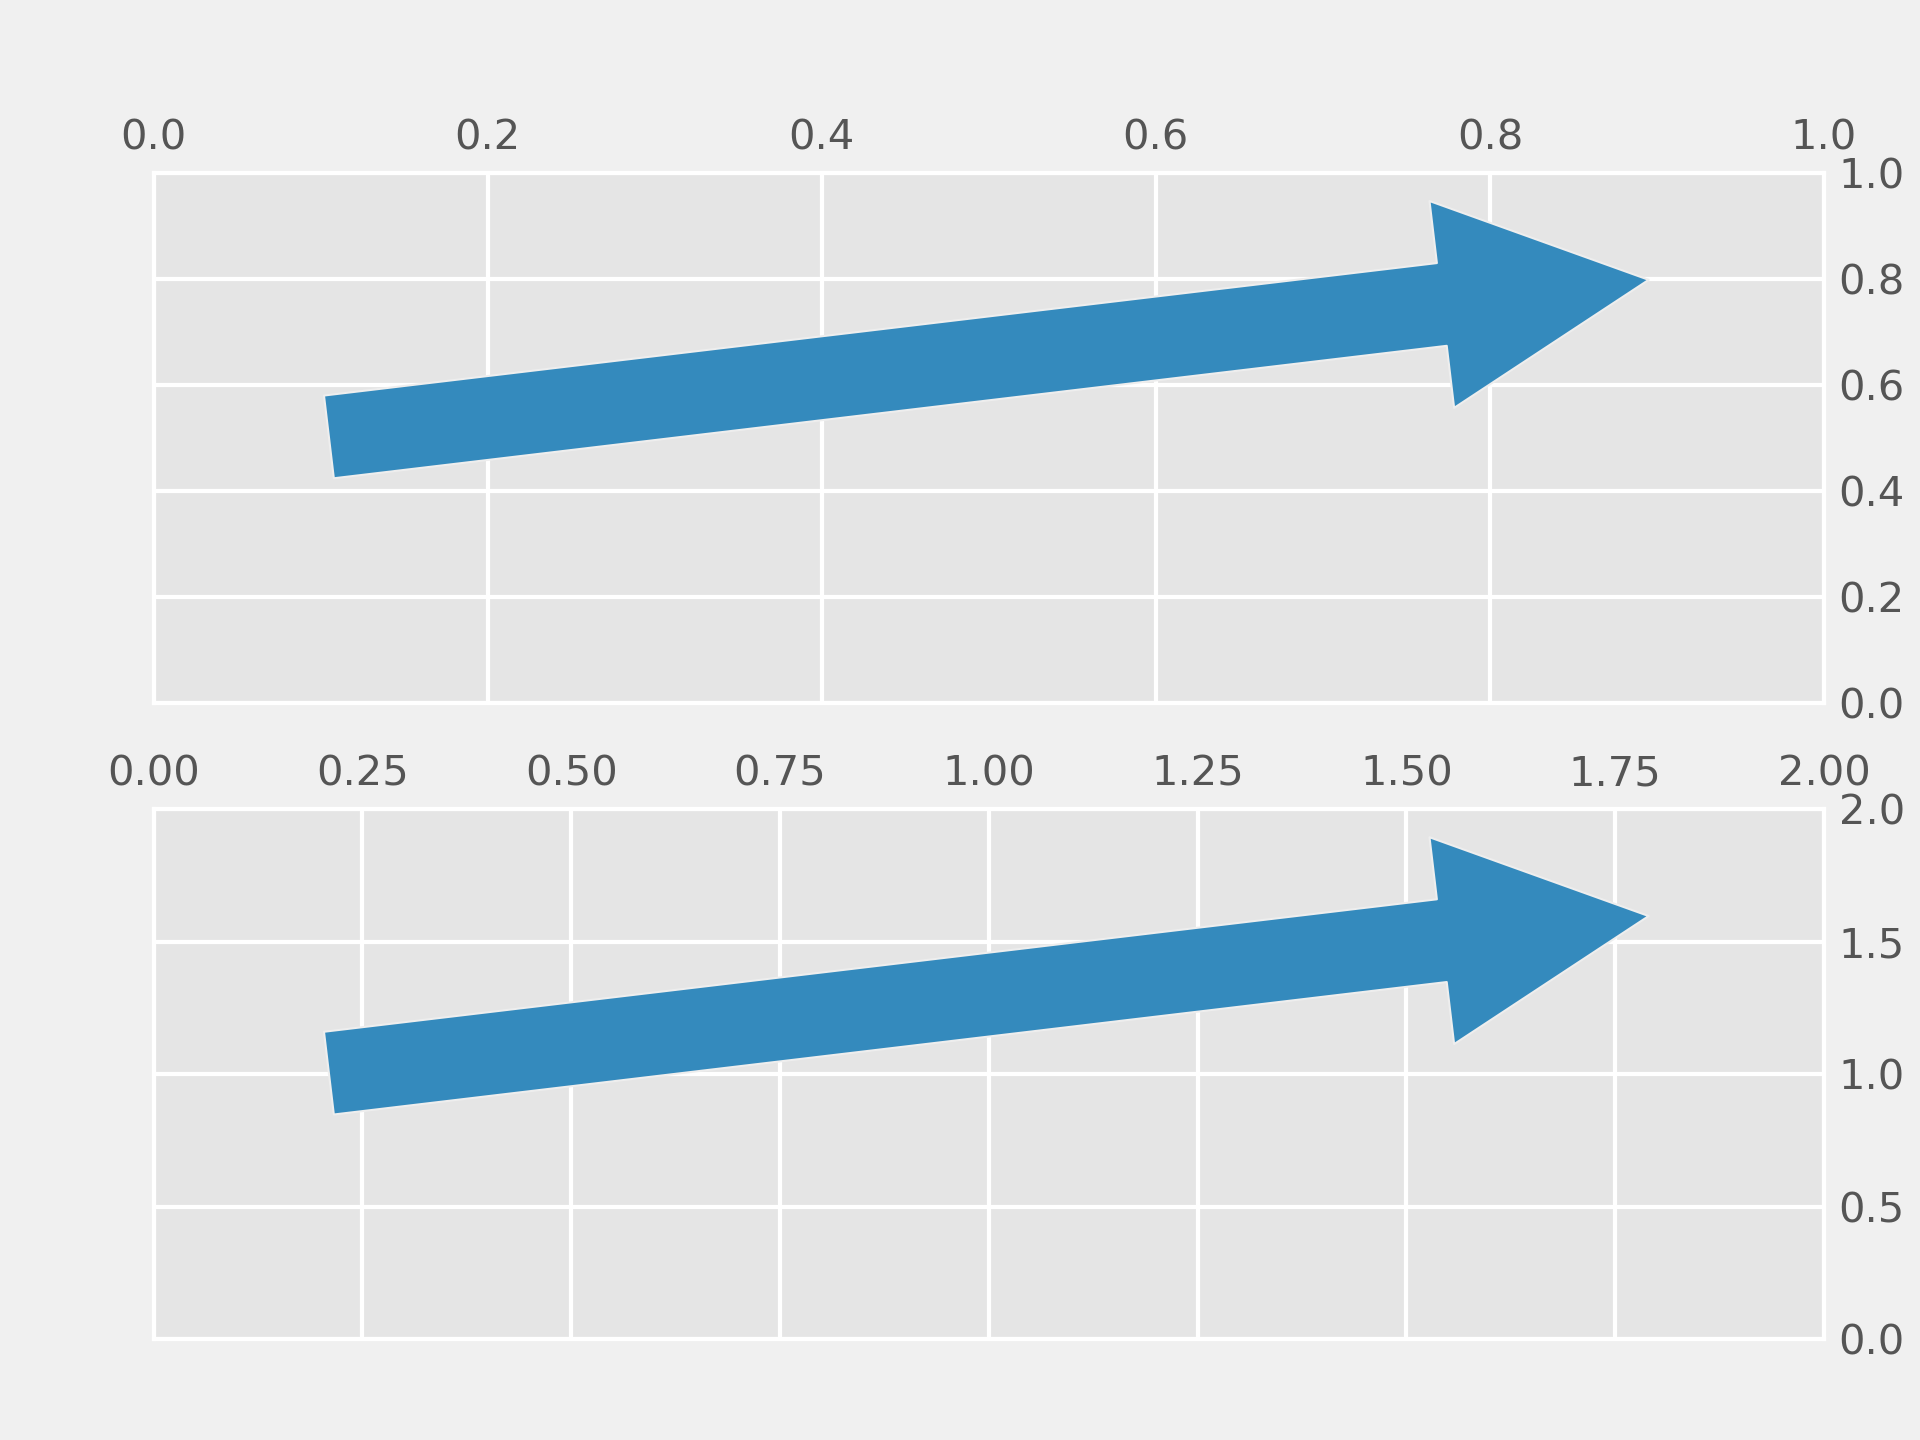
... ###############################################################################
... # Head shape and anchor points fixed in display space
... # ---------------------------------------------------
... #
... # This is useful if you are annotating a plot, and don't want the arrow to
... # change shape or position if you pan or scale the plot.
... #
... # In this case we use `.patches.FancyArrowPatch`, and pass the keyword argument
... # ``transform=ax.transAxes`` where ``ax`` is the axes we are adding the patch
... # to.
... #
... # Note that when the axis limits are changed, the arrow shape and location
... # stay the same.
...
... fig, axs = plt.subplots(nrows=2)
... arrow = mpatches.FancyArrowPatch((x_tail, y_tail), (x_head, y_head),
... mutation_scale=100,
... transform=axs[0].transAxes)
... axs[0].add_patch(arrow)
...
... arrow = mpatches.FancyArrowPatch((x_tail, y_tail), (x_head, y_head),
... mutation_scale=100,
... transform=axs[1].transAxes)
... axs[1].add_patch(arrow)
... axs[1].set(xlim=(0, 2), ylim=(0, 2))
...
...
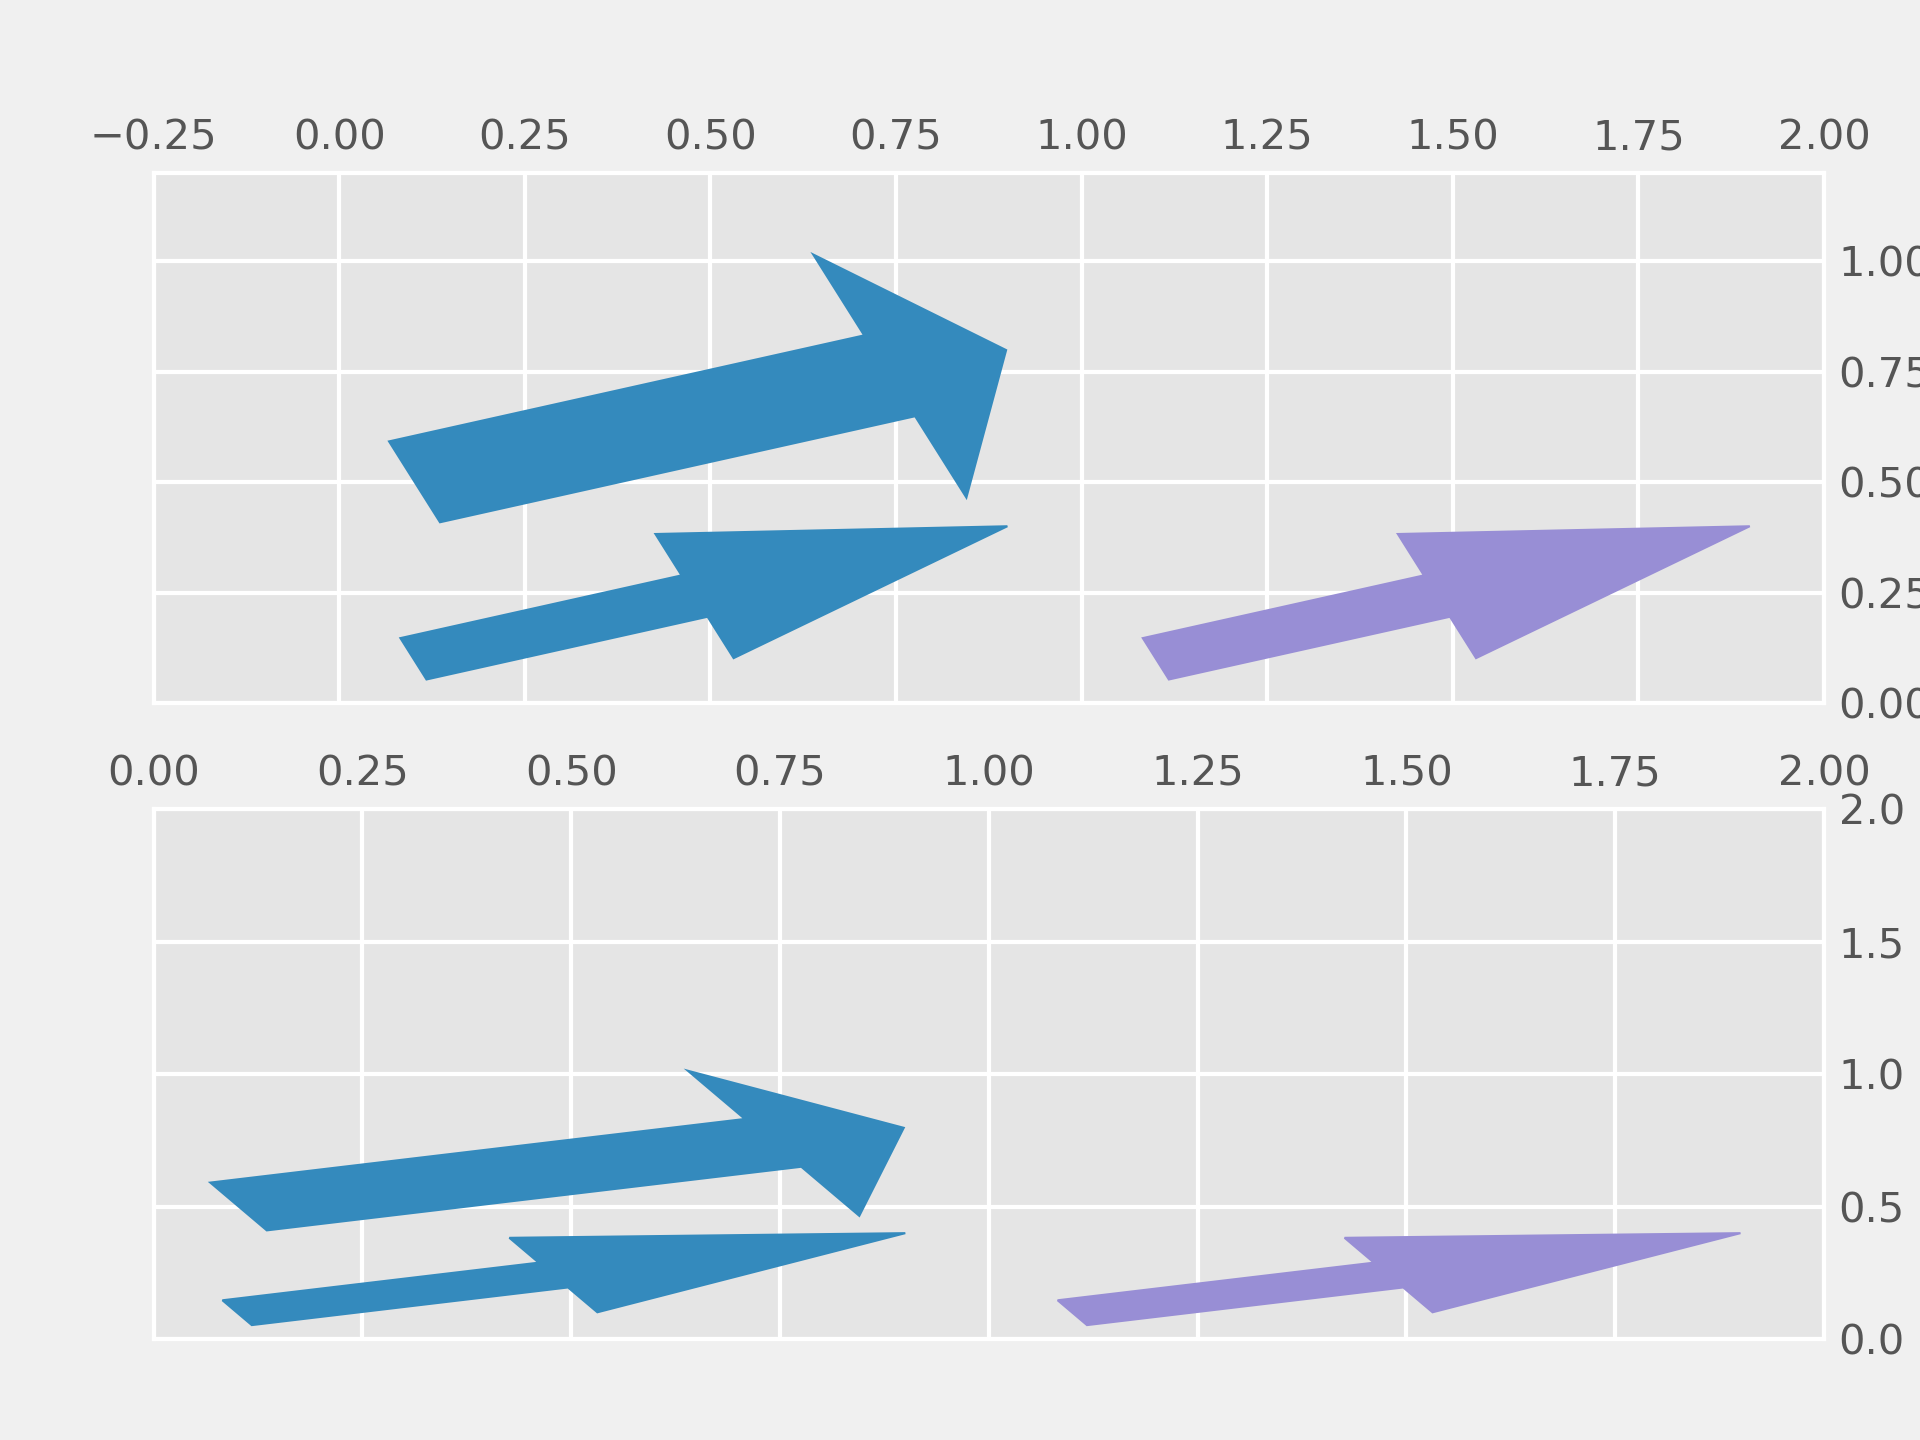
... ###############################################################################
... # Head shape and anchor points fixed in data space
... # ------------------------------------------------
... #
... # In this case we use `.patches.Arrow`, or `.patches.FancyArrow` (the latter is
... # in orange).
... #
... # Note that when the axis limits are changed, the arrow shape and location
... # change.
... #
... # `.FancyArrow`'s API is relatively awkward, and requires in particular passing
... # ``length_includes_head=True`` so that the arrow *tip* is ``(dx, dy)`` away
... # from the arrow start. It is only included in this reference because it is
... # the arrow class returned by `.Axes.arrow` (in green).
...
... fig, axs = plt.subplots(nrows=2)
...
... arrow = mpatches.Arrow(x_tail, y_tail, dx, dy)
... axs[0].add_patch(arrow)
... arrow = mpatches.FancyArrow(x_tail, y_tail - .4, dx, dy,
... width=.1, length_includes_head=True, color="C1")
... axs[0].add_patch(arrow)
... axs[0].arrow(x_tail + 1, y_tail - .4, dx, dy,
... width=.1, length_includes_head=True, color="C2")
...
... arrow = mpatches.Arrow(x_tail, y_tail, dx, dy)
... axs[1].add_patch(arrow)
... arrow = mpatches.FancyArrow(x_tail, y_tail - .4, dx, dy,
... width=.1, length_includes_head=True, color="C1")
... axs[1].add_patch(arrow)
... axs[1].arrow(x_tail + 1, y_tail - .4, dx, dy,
... width=.1, length_includes_head=True, color="C2")
... axs[1].set(xlim=(0, 2), ylim=(0, 2))
...
... ###############################################################################
...
... plt.show()
...