>>> """
=================
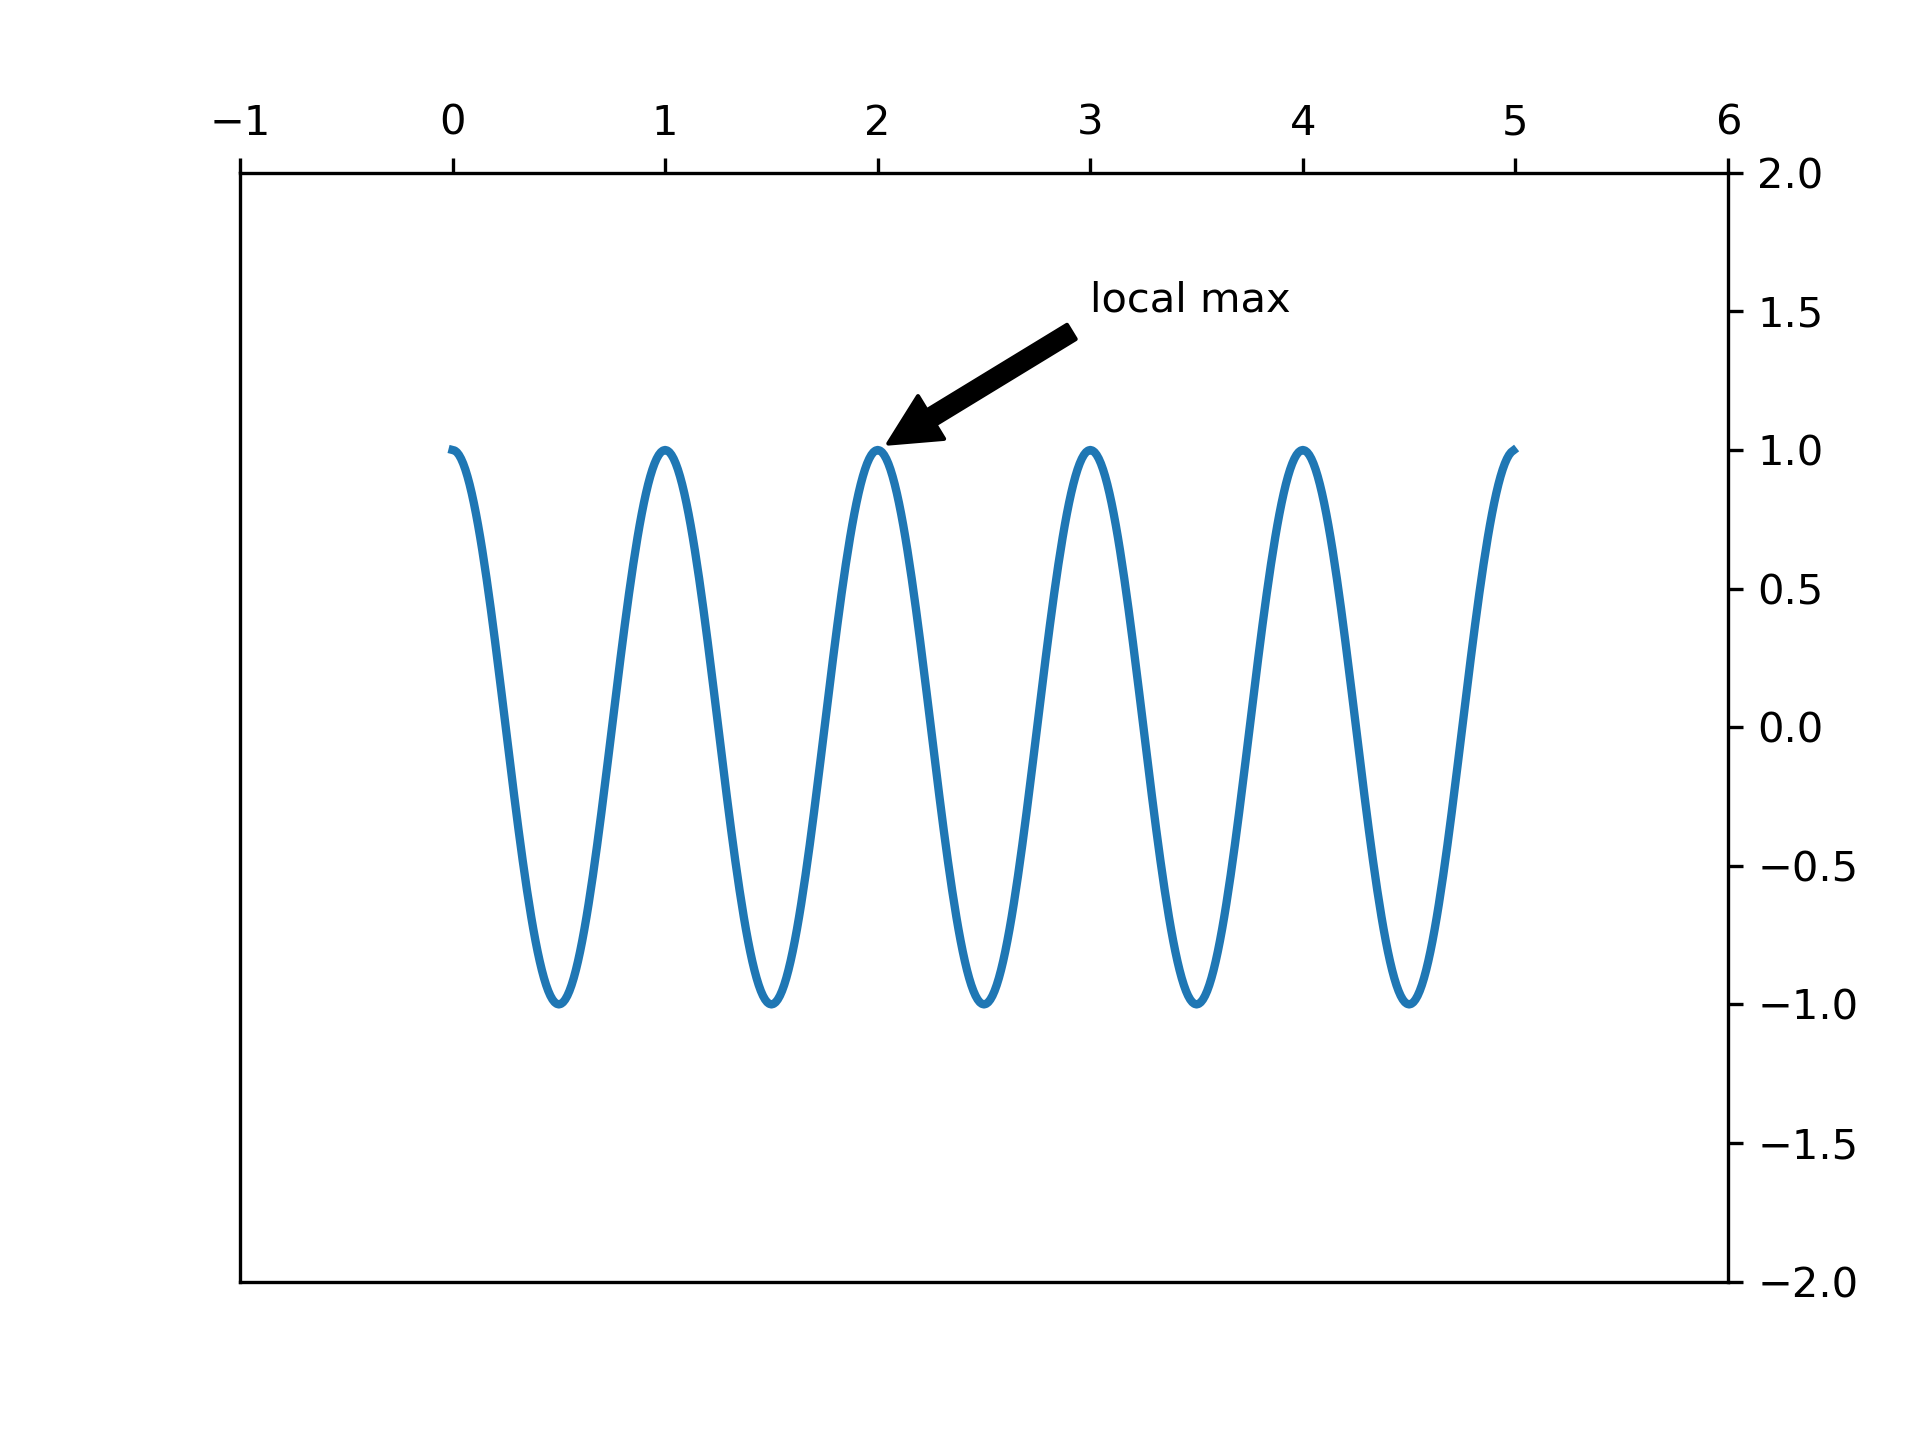
Annotating a plot
=================
This example shows how to annotate a plot with an arrow pointing to provided
coordinates. We modify the defaults of the arrow, to "shrink" it.
For a complete overview of the annotation capabilities, also see the
:doc:`annotation tutorial</tutorials/text/annotations>`.
"""
... import numpy as np
... import matplotlib.pyplot as plt
...
... fig, ax = plt.subplots()
...
... t = np.arange(0.0, 5.0, 0.01)
... s = np.cos(2*np.pi*t)
... line, = ax.plot(t, s, lw=2)
...
... ax.annotate('local max', xy=(2, 1), xytext=(3, 1.5),
... arrowprops=dict(facecolor='black', shrink=0.05),
... )
... ax.set_ylim(-2, 2)
... plt.show()
...
... #############################################################################
... #
... # .. admonition:: References
... #
... # The use of the following functions, methods, classes and modules is shown
... # in this example:
... #
... # - `matplotlib.axes.Axes.annotate` / `matplotlib.pyplot.annotate`
...