>>> """
=======================
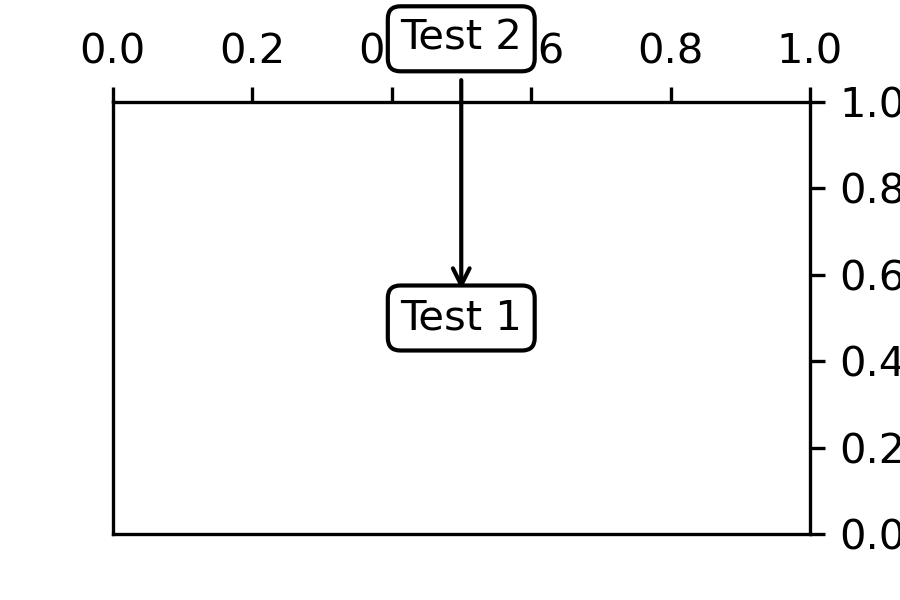
Annotate Simple Coord02
=======================
"""
...
... import matplotlib.pyplot as plt
...
...
... fig, ax = plt.subplots(figsize=(3, 2))
... an1 = ax.annotate("Test 1", xy=(0.5, 0.5), xycoords="data",
... va="center", ha="center",
... bbox=dict(boxstyle="round", fc="w"))
...
... an2 = ax.annotate("Test 2", xy=(0.5, 1.), xycoords=an1,
... xytext=(0.5, 1.1), textcoords=(an1, "axes fraction"),
... va="bottom", ha="center",
... bbox=dict(boxstyle="round", fc="w"),
... arrowprops=dict(arrowstyle="->"))
...
... fig.subplots_adjust(top=0.83)
... plt.show()
...