>>> """ ================= Annotate Simple03 ================= """
... import matplotlib.pyplot as plt
...
...
... fig, ax = plt.subplots(figsize=(3, 3))
...
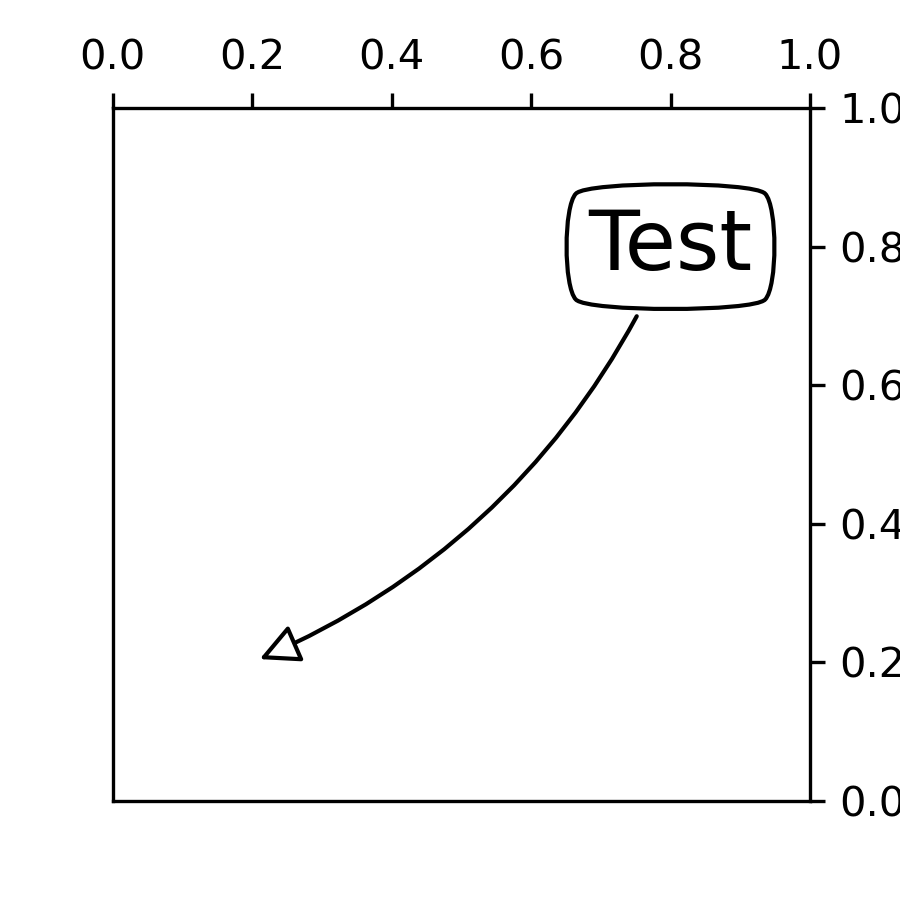
... ann = ax.annotate("Test",
... xy=(0.2, 0.2), xycoords='data',
... xytext=(0.8, 0.8), textcoords='data',
... size=20, va="center", ha="center",
... bbox=dict(boxstyle="round4", fc="w"),
... arrowprops=dict(arrowstyle="-|>",
... connectionstyle="arc3,rad=-0.2",
... fc="w"),
... )
...
... plt.show()
...