>>> """
==================
Animated histogram
==================
Use histogram's `.BarContainer` to draw a bunch of rectangles for an animated
histogram.
"""
...
... import numpy as np
...
... import matplotlib.pyplot as plt
... import matplotlib.animation as animation
...
... # Fixing random state for reproducibility
... np.random.seed(19680801)
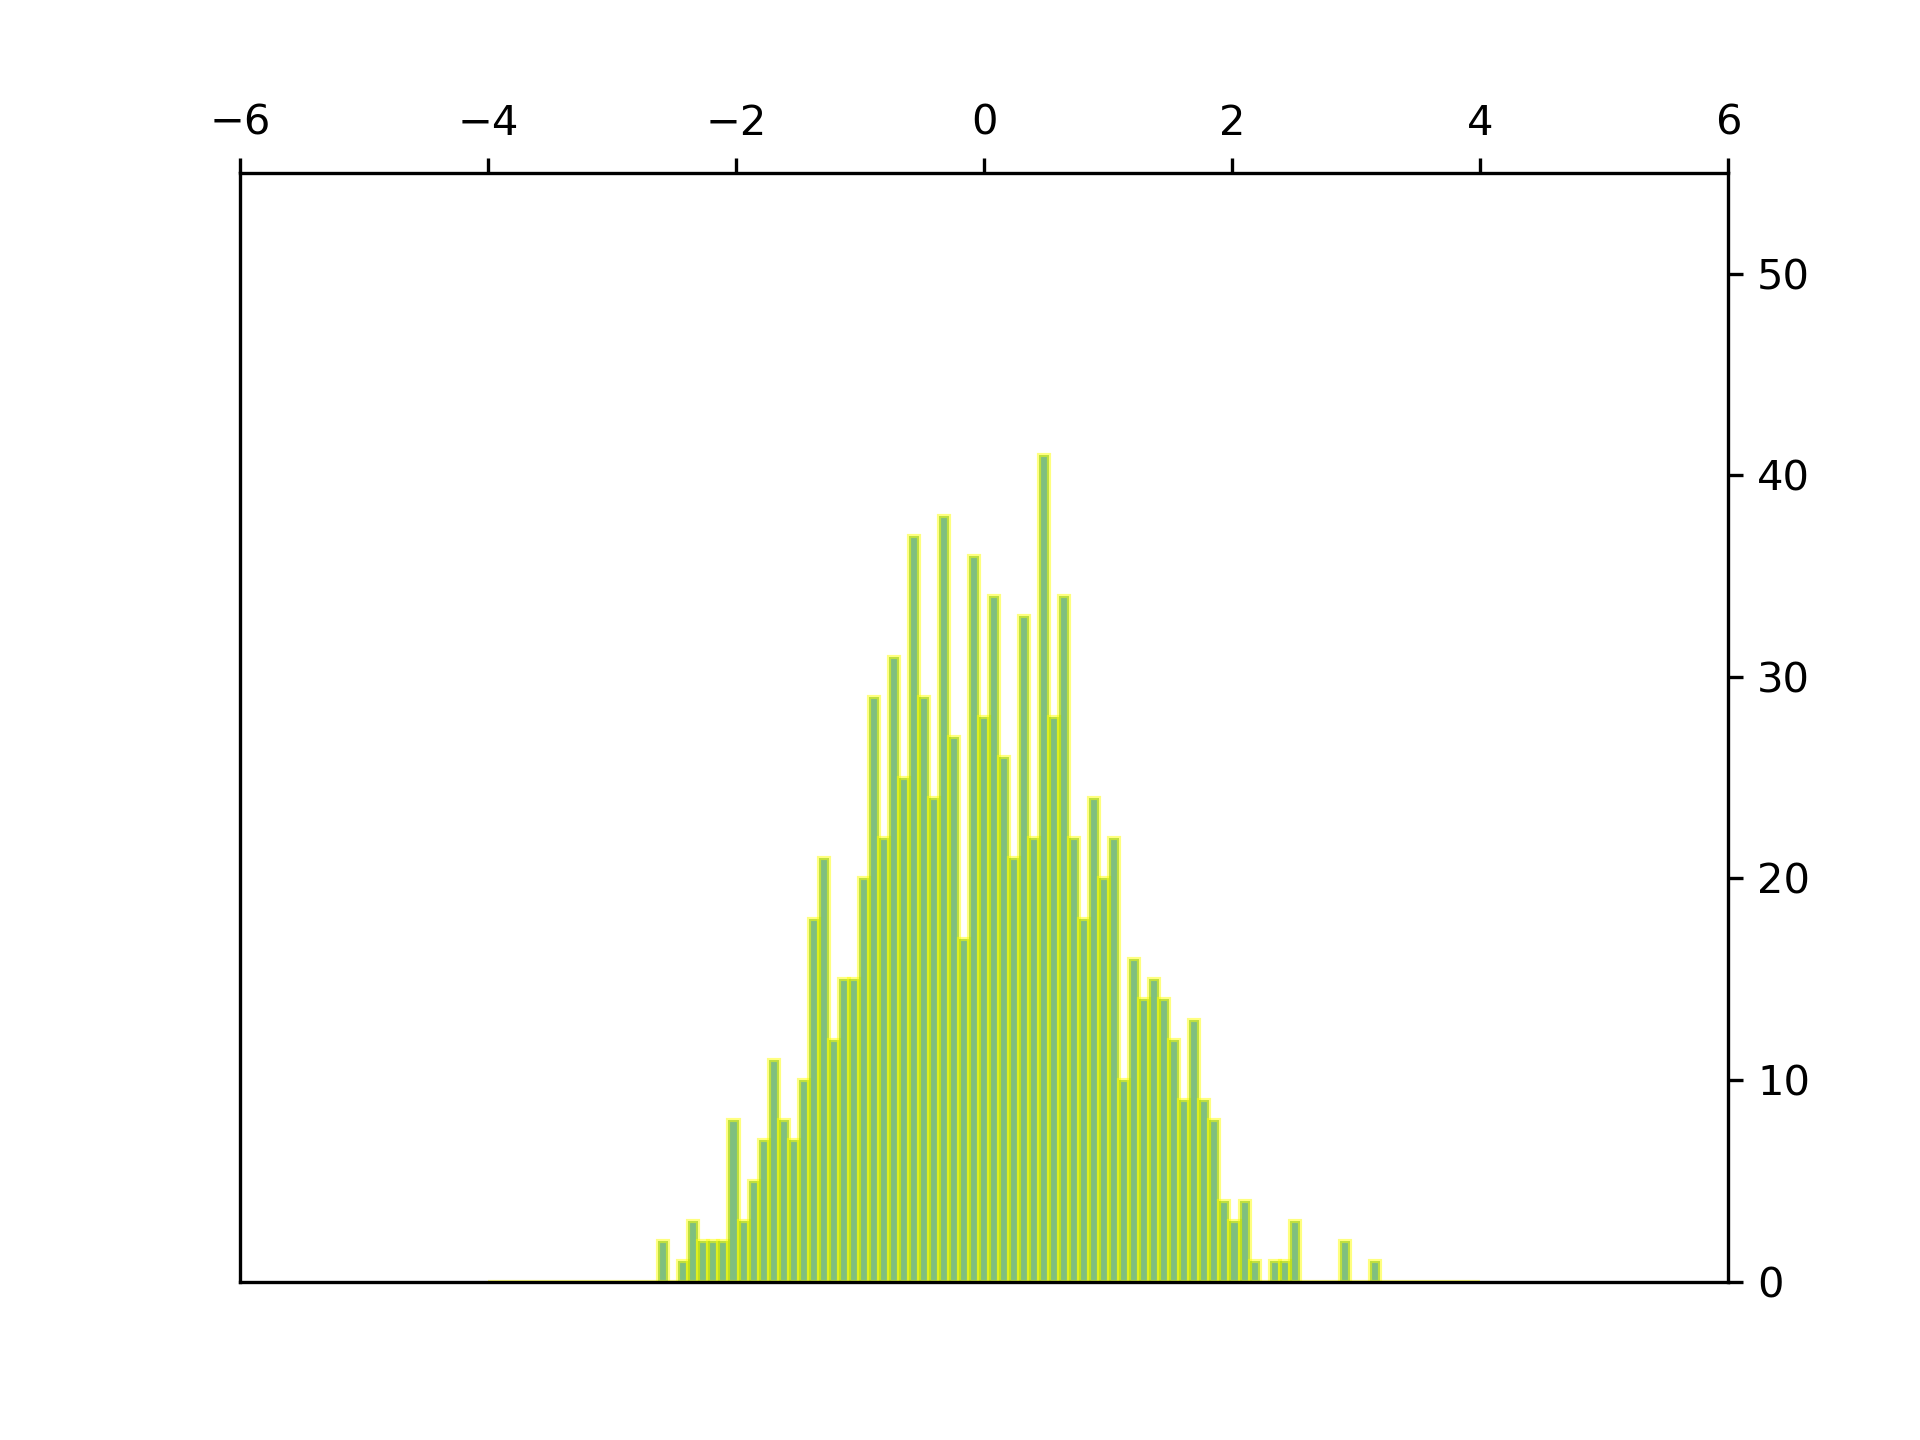
... # Fixing bin edges
... HIST_BINS = np.linspace(-4, 4, 100)
...
... # histogram our data with numpy
... data = np.random.randn(1000)
... n, _ = np.histogram(data, HIST_BINS)
...
... ###############################################################################
... # To animate the histogram, we need an ``animate`` function, which generates
... # a random set of numbers and updates the heights of rectangles. We utilize a
... # python closure to track an instance of `.BarContainer` whose `.Rectangle`
... # patches we shall update.
...
...
... def prepare_animation(bar_container):
...
... def animate(frame_number):
... # simulate new data coming in
... data = np.random.randn(1000)
... n, _ = np.histogram(data, HIST_BINS)
... for count, rect in zip(n, bar_container.patches):
... rect.set_height(count)
... return bar_container.patches
... return animate
...
... ###############################################################################
... # Using :func:`~matplotlib.pyplot.hist` allows us to get an instance of
... # `.BarContainer`, which is a collection of `.Rectangle` instances. Calling
... # ``prepare_animation`` will define ``animate`` function working with supplied
... # `.BarContainer`, all this is used to setup `.FuncAnimation`.
...
... fig, ax = plt.subplots()
... _, _, bar_container = ax.hist(data, HIST_BINS, lw=1,
... ec="yellow", fc="green", alpha=0.5)
... ax.set_ylim(top=55) # set safe limit to ensure that all data is visible.
...
... ani = animation.FuncAnimation(fig, prepare_animation(bar_container), 50,
... repeat=False, blit=True)
... plt.show()
...