>>> """
==============
Align y-labels
==============
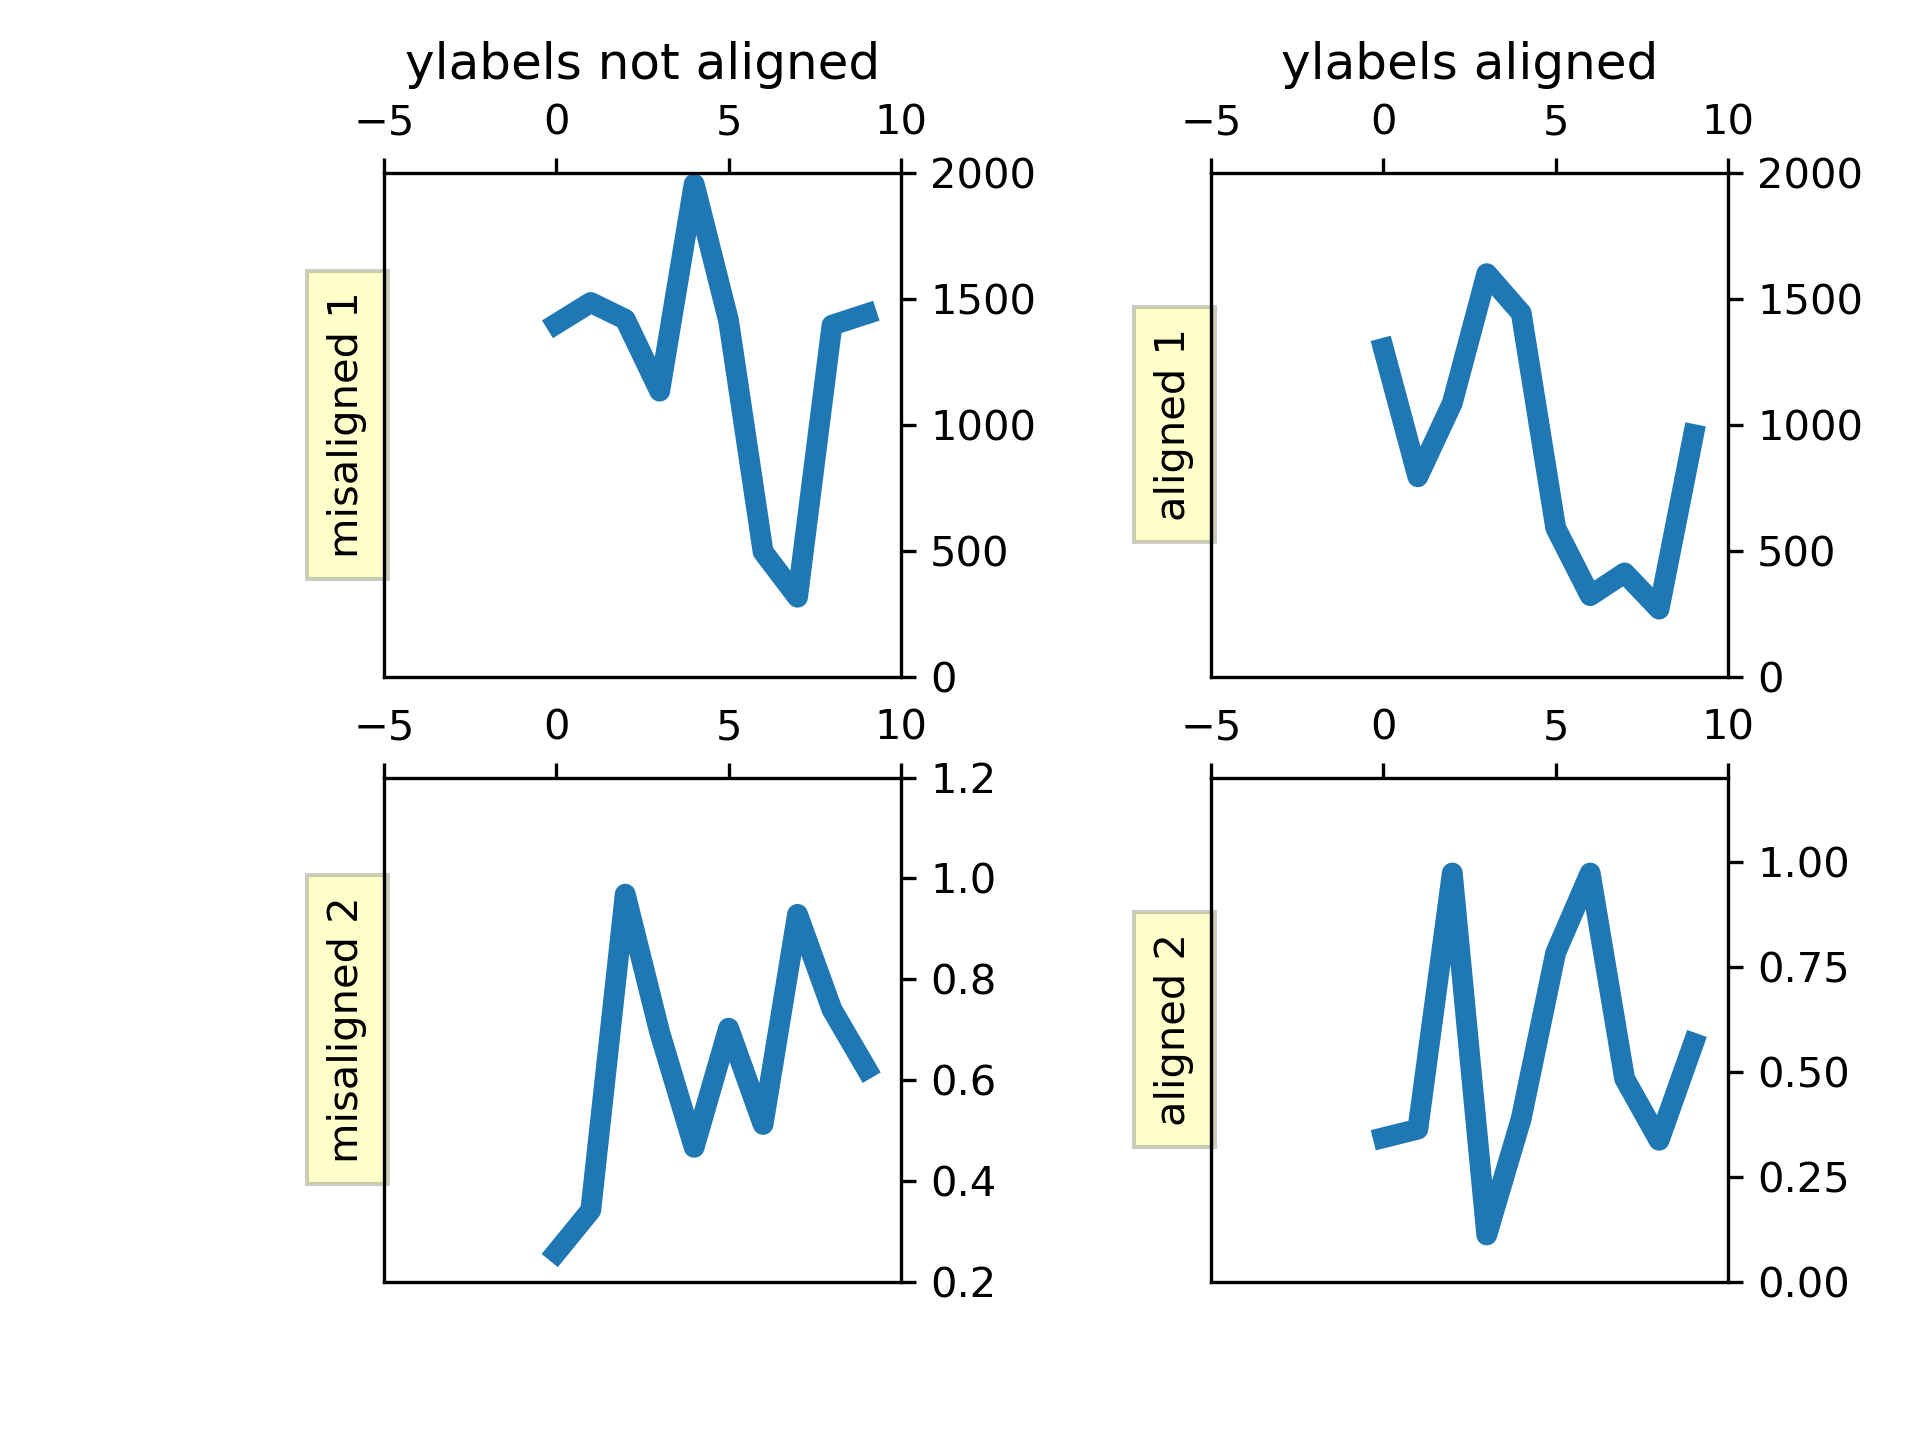
Two methods are shown here, one using a short call to `.Figure.align_ylabels`
and the second a manual way to align the labels.
"""
... import numpy as np
... import matplotlib.pyplot as plt
...
...
... def make_plot(axs):
... box = dict(facecolor='yellow', pad=5, alpha=0.2)
...
... # Fixing random state for reproducibility
... np.random.seed(19680801)
... ax1 = axs[0, 0]
... ax1.plot(2000*np.random.rand(10))
... ax1.set_title('ylabels not aligned')
... ax1.set_ylabel('misaligned 1', bbox=box)
... ax1.set_ylim(0, 2000)
...
... ax3 = axs[1, 0]
... ax3.set_ylabel('misaligned 2', bbox=box)
... ax3.plot(np.random.rand(10))
...
... ax2 = axs[0, 1]
... ax2.set_title('ylabels aligned')
... ax2.plot(2000*np.random.rand(10))
... ax2.set_ylabel('aligned 1', bbox=box)
... ax2.set_ylim(0, 2000)
...
... ax4 = axs[1, 1]
... ax4.plot(np.random.rand(10))
... ax4.set_ylabel('aligned 2', bbox=box)
...
...
... # Plot 1:
... fig, axs = plt.subplots(2, 2)
... fig.subplots_adjust(left=0.2, wspace=0.6)
... make_plot(axs)
...
... # just align the last column of axes:
... fig.align_ylabels(axs[:, 1])
... plt.show()
...
... #############################################################################
... #
... # .. seealso::
... # `.Figure.align_ylabels` and `.Figure.align_labels` for a direct method
... # of doing the same thing.
... # Also :doc:`/gallery/subplots_axes_and_figures/align_labels_demo`
... #
... #
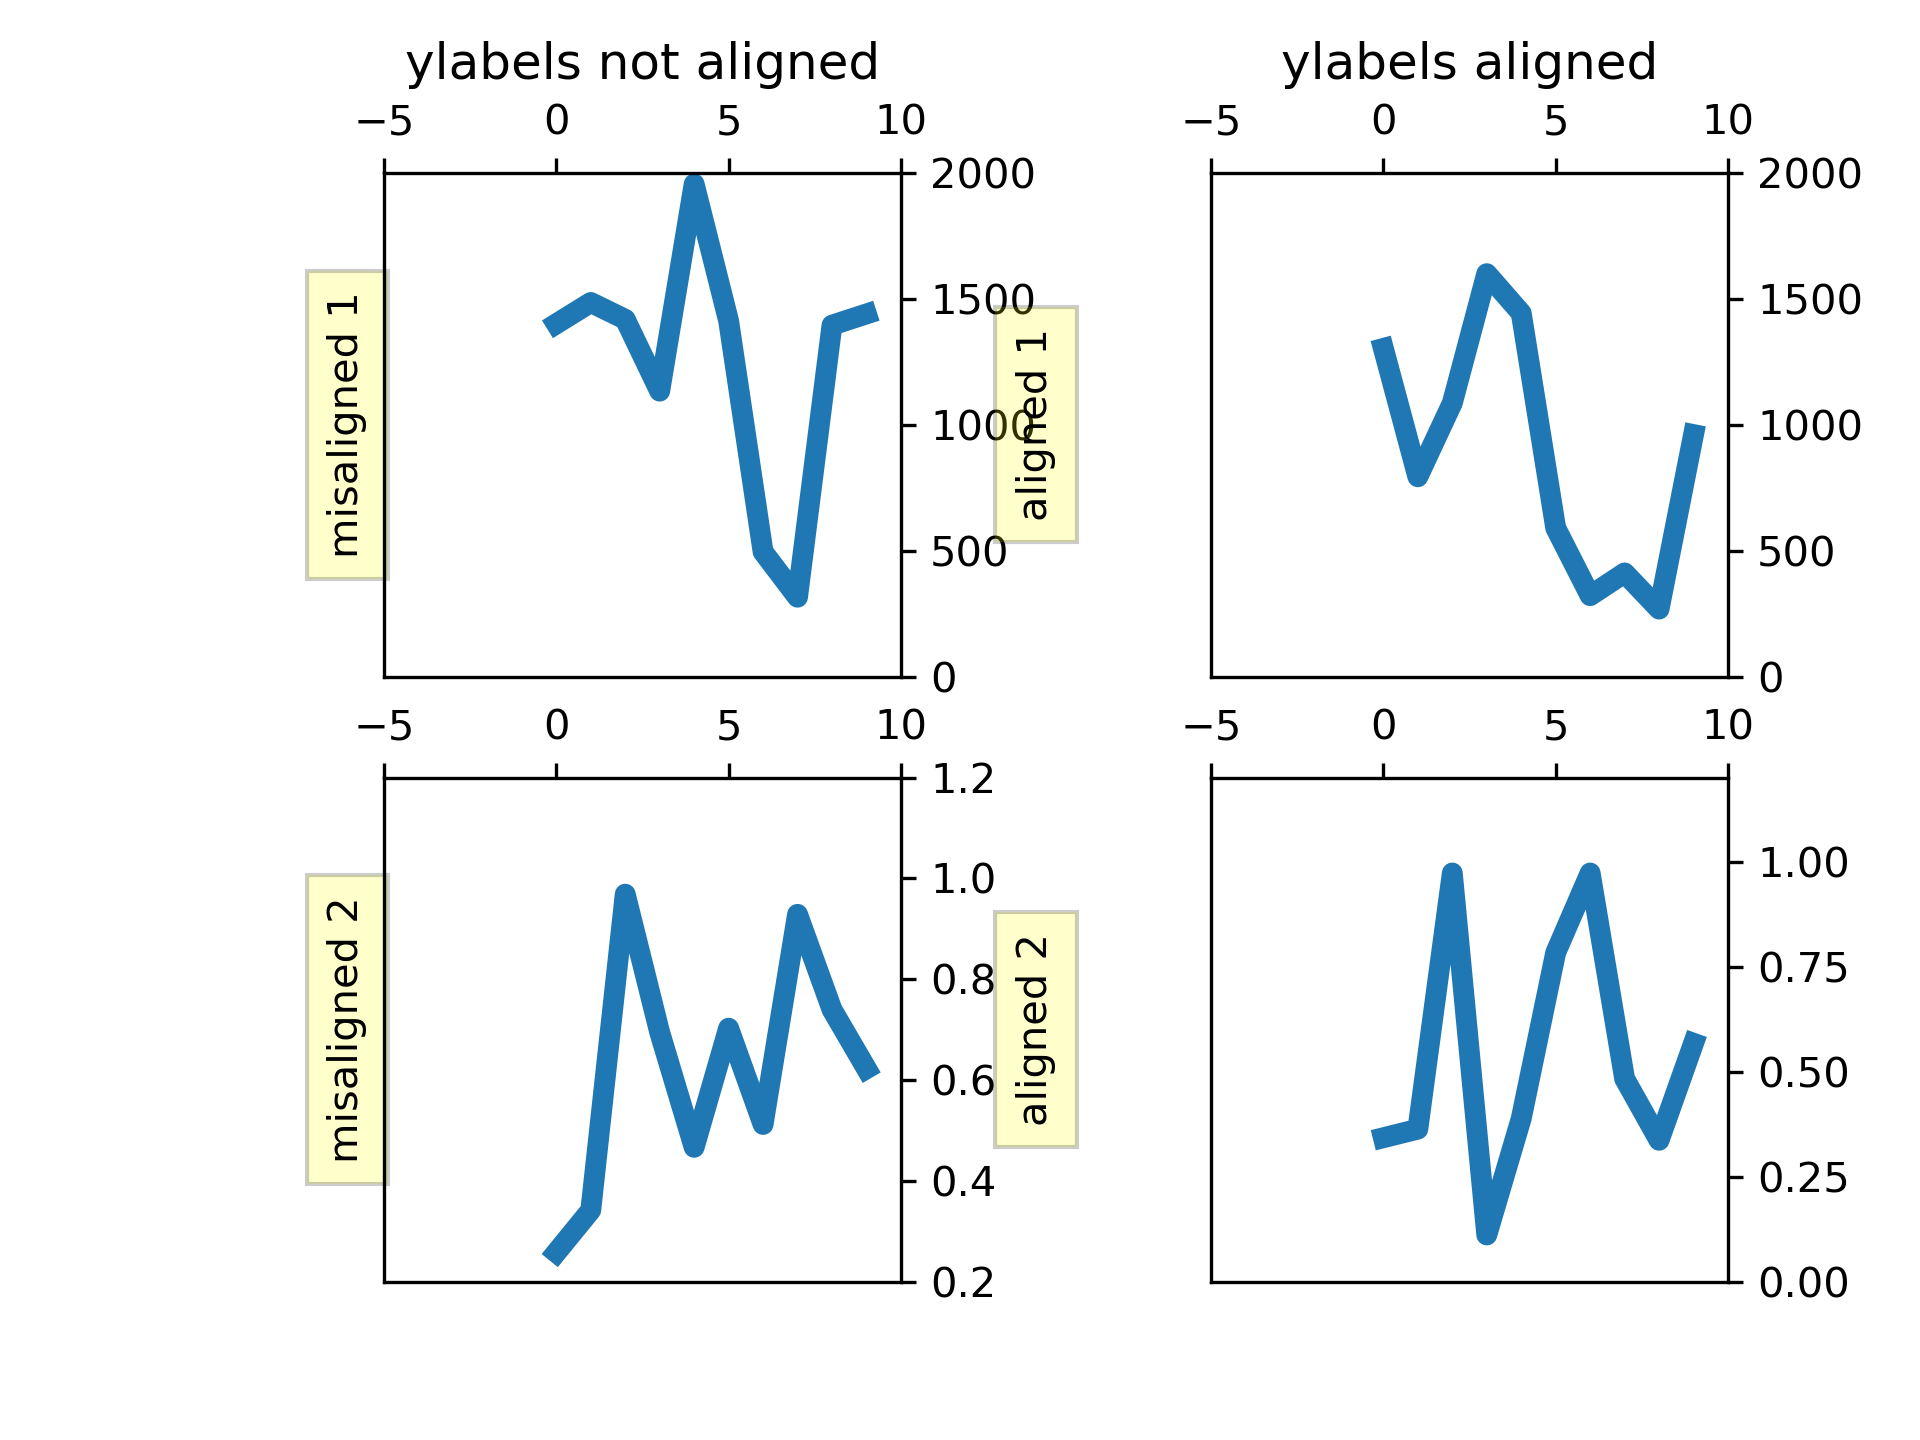
... # Or we can manually align the axis labels between subplots manually using the
... # `~.Axis.set_label_coords` method of the y-axis object. Note this requires
... # we know a good offset value which is hardcoded.
...
... fig, axs = plt.subplots(2, 2)
... fig.subplots_adjust(left=0.2, wspace=0.6)
...
... make_plot(axs)
...
... labelx = -0.3 # axes coords
...
... for j in range(2):
... axs[j, 1].yaxis.set_label_coords(labelx, 0.5)
...
... plt.show()
...
... #############################################################################
... #
... # .. admonition:: References
... #
... # The use of the following functions, methods, classes and modules is shown
... # in this example:
... #
... # - `matplotlib.figure.Figure.align_ylabels`
... # - `matplotlib.axis.Axis.set_label_coords`
... # - `matplotlib.axes.Axes.plot` / `matplotlib.pyplot.plot`
... # - `matplotlib.axes.Axes.set_title`
... # - `matplotlib.axes.Axes.set_ylabel`
... # - `matplotlib.axes.Axes.set_ylim`
...