>>> """
===============
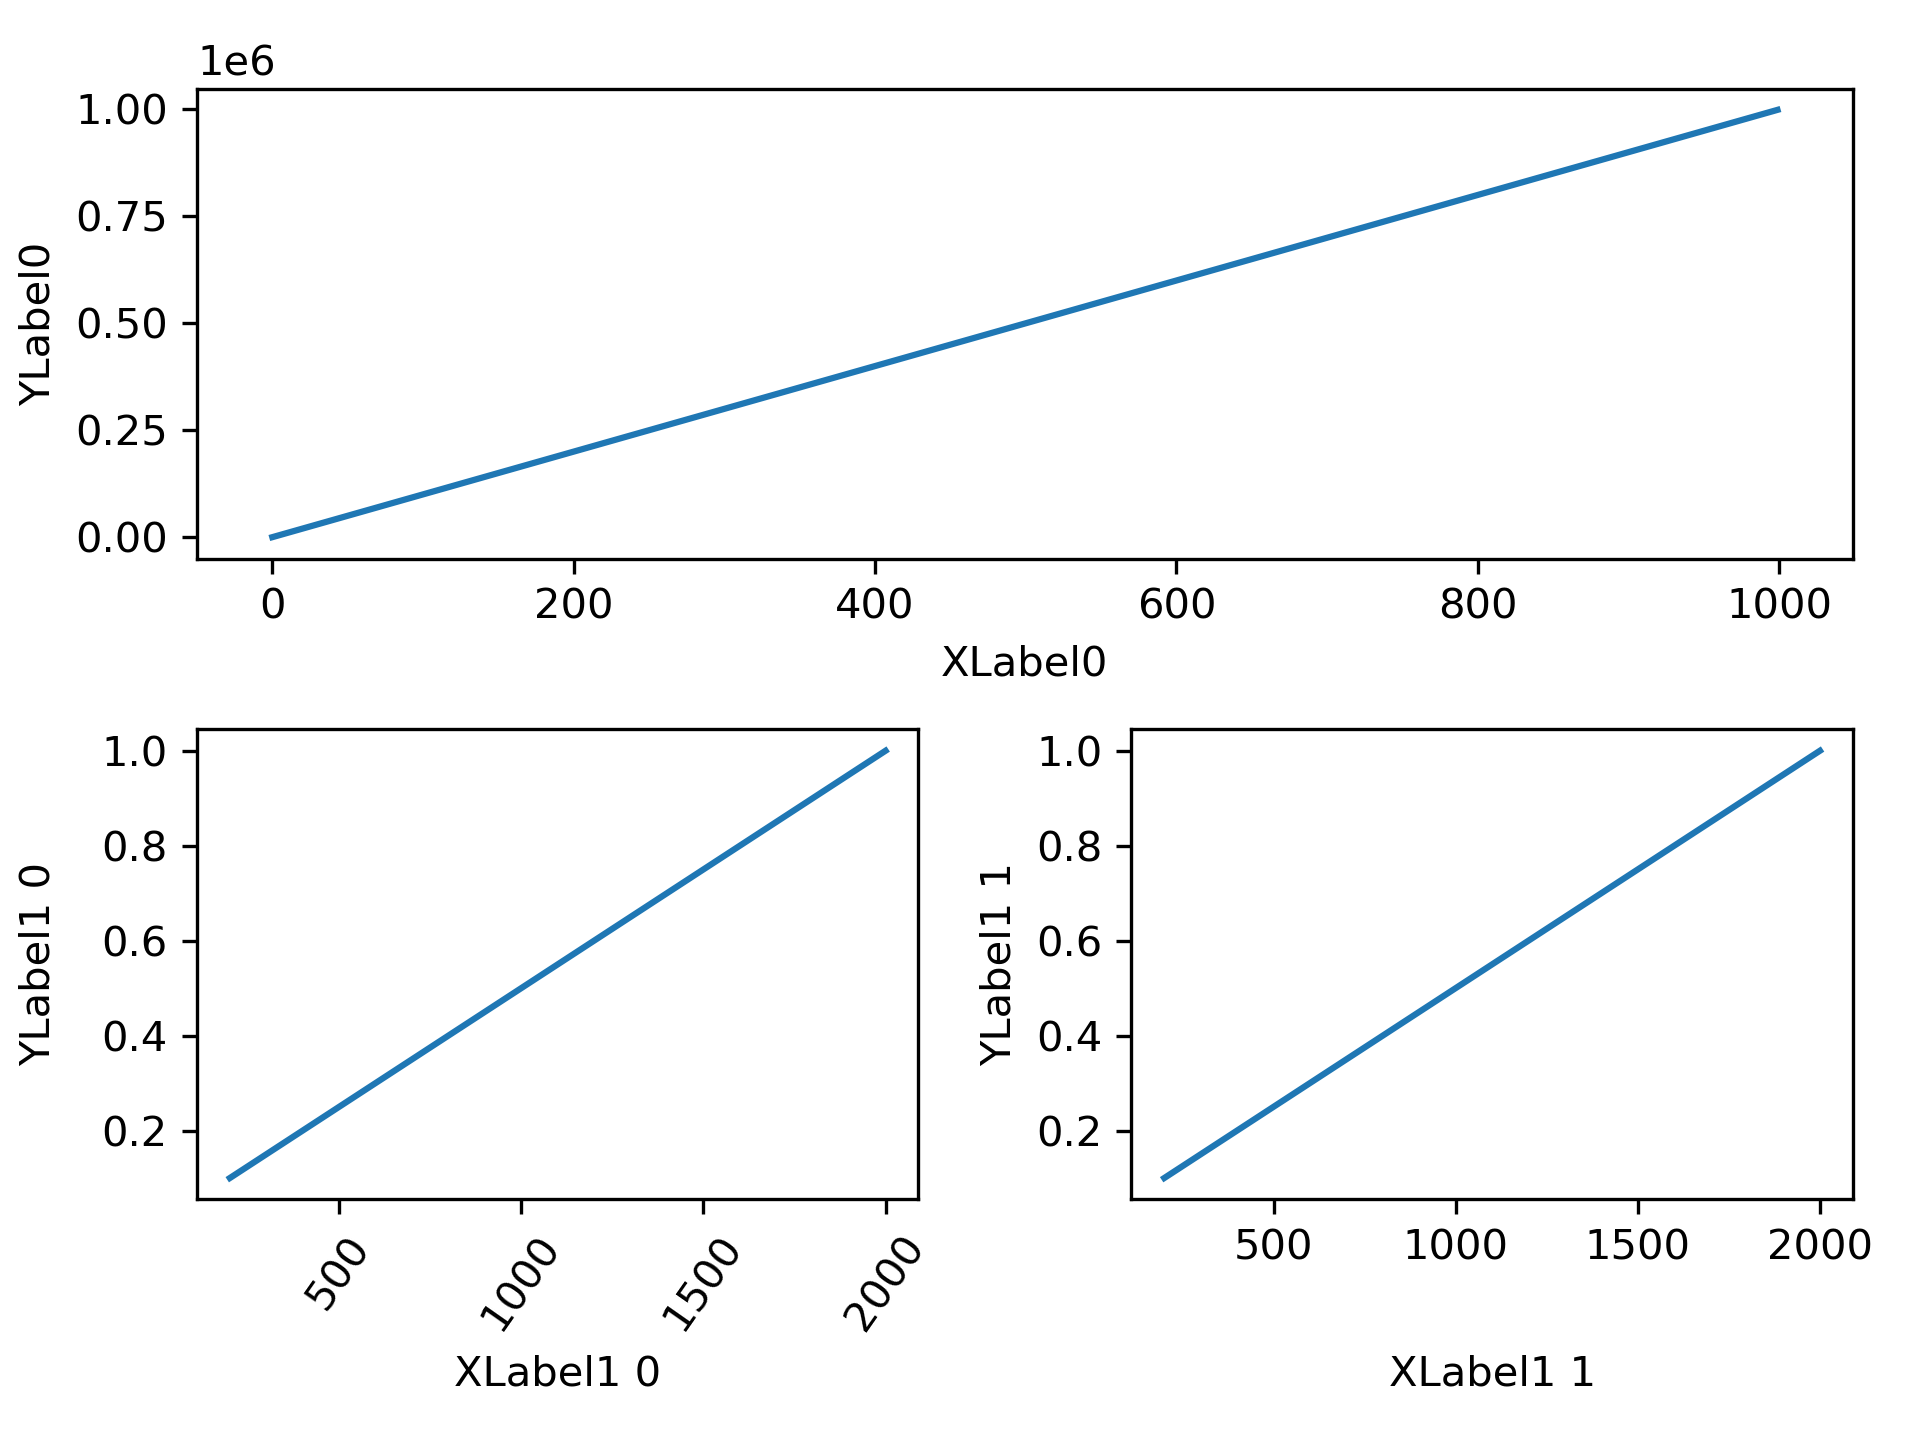
Aligning Labels
===============
Aligning xlabel and ylabel using `.Figure.align_xlabels` and
`.Figure.align_ylabels`
`.Figure.align_labels` wraps these two functions.
Note that the xlabel "XLabel1 1" would normally be much closer to the
x-axis, and "YLabel1 0" would be much closer to the y-axis of their
respective axes.
"""
... import matplotlib.pyplot as plt
... import numpy as np
... import matplotlib.gridspec as gridspec
...
... fig = plt.figure(tight_layout=True)
... gs = gridspec.GridSpec(2, 2)
...
... ax = fig.add_subplot(gs[0, :])
... ax.plot(np.arange(0, 1e6, 1000))
... ax.set_ylabel('YLabel0')
... ax.set_xlabel('XLabel0')
...
... for i in range(2):
... ax = fig.add_subplot(gs[1, i])
... ax.plot(np.arange(1., 0., -0.1) * 2000., np.arange(1., 0., -0.1))
... ax.set_ylabel('YLabel1 %d' % i)
... ax.set_xlabel('XLabel1 %d' % i)
... if i == 0:
... for tick in ax.get_xticklabels():
... tick.set_rotation(55)
... fig.align_labels() # same as fig.align_xlabels(); fig.align_ylabels()
...
... plt.show()
...