>>> """
=====================
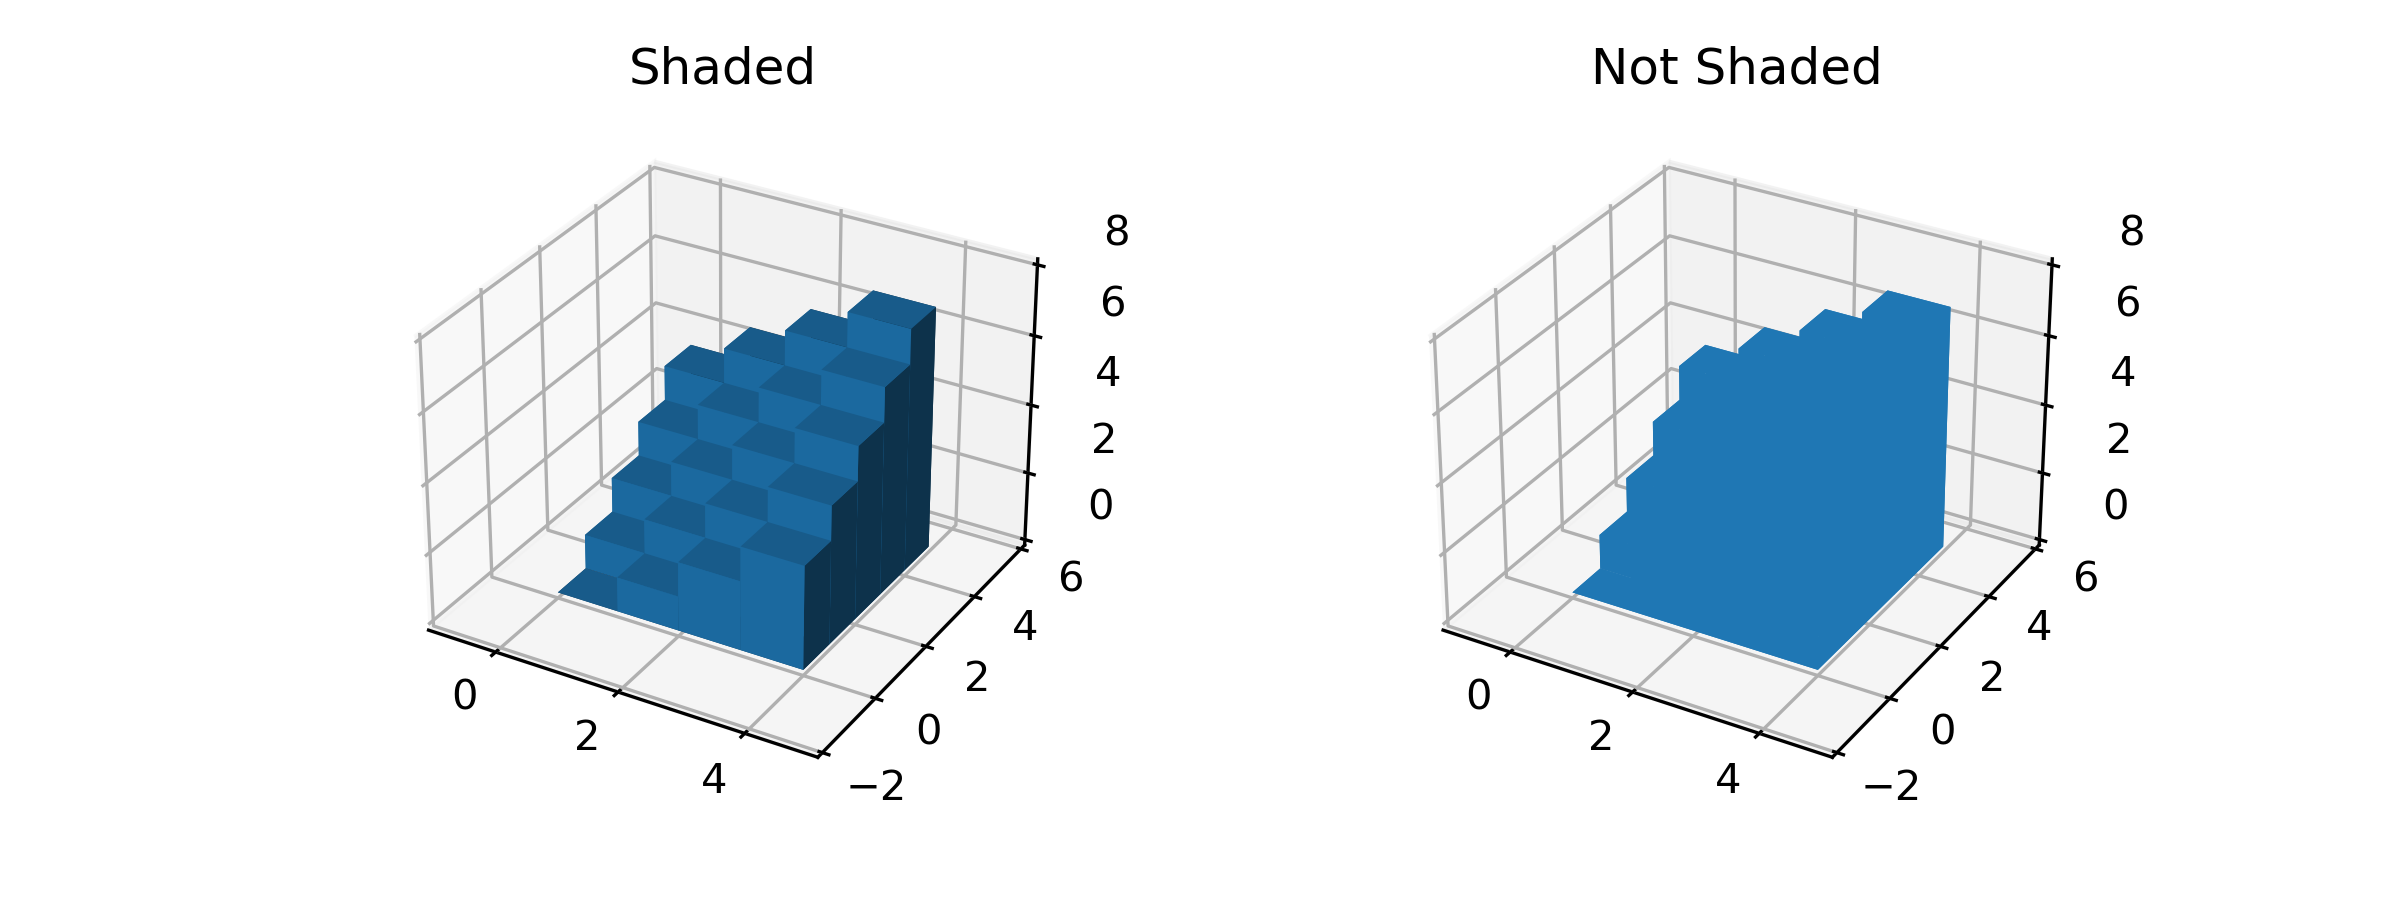
Demo of 3D bar charts
=====================
A basic demo of how to plot 3D bars with and without shading.
"""
...
... import numpy as np
... import matplotlib.pyplot as plt
...
...
... # setup the figure and axes
... fig = plt.figure(figsize=(8, 3))
... ax1 = fig.add_subplot(121, projection='3d')
... ax2 = fig.add_subplot(122, projection='3d')
...
... # fake data
... _x = np.arange(4)
... _y = np.arange(5)
... _xx, _yy = np.meshgrid(_x, _y)
... x, y = _xx.ravel(), _yy.ravel()
...
... top = x + y
... bottom = np.zeros_like(top)
... width = depth = 1
...
... ax1.bar3d(x, y, bottom, width, depth, top, shade=True)
... ax1.set_title('Shaded')
...
... ax2.bar3d(x, y, bottom, width, depth, top, shade=False)
... ax2.set_title('Not Shaded')
...
... plt.show()
...